Analysis VCL instantly processes arrays and transforms database information into compact and generalized reports. Integrate the OLAP library into your project, prepare the data (or several sets) that your users will need for analysis, and get BI in your application.

Cross table
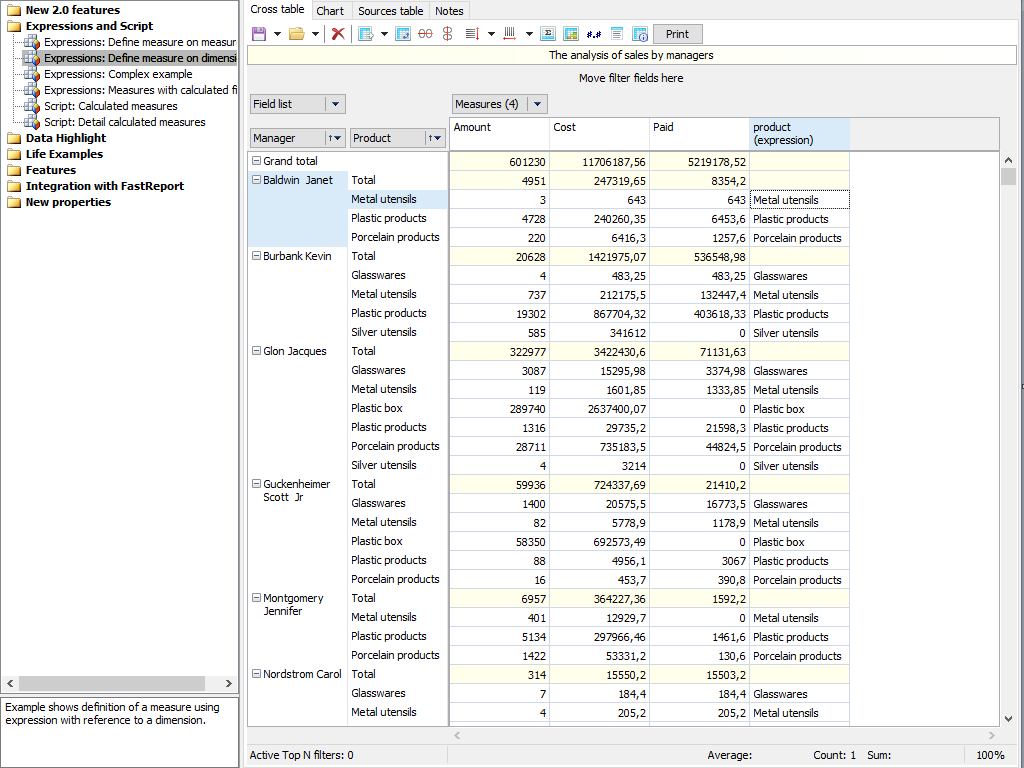
The Analysis VCL consists of a cross-table—an interactive tool for data presentation and analysis. In the upper and left parts of the table, there are multi-level headers filled with the values of the dimensions. The central part of the table displays the values of the indicators.
The cross-table consists of many areas: the header of the cross-table, the area of the filter fields, the vertical and horizontal headers of the dimensions, the vertical and horizontal header of the cross-table, the data area, the field list, the list of Top-N filters, the area of aggregate calculations for the selected cells, and scale control.

Sorting
The data in the cross-table is displayed in a strictly sorted order, regardless of their original order in the source data. The sorting order can be either ascending or descending. For numeric and time-based values, the order means their natural order of succession. For string values, the alphabetical order of succession is applied.
Each dimension of the cross-table can have its sorting order of values. By default, ascending sorting is applied. You can change the sorting order of a dimension by double-clicking on the dimension header or selecting an option in the context menu.
Features and Benefits Analysis VCL

Conditional data selection
The cross-table allows you to set the display style for certain metric values. You can select data within a certain range or beyond its boundaries. The selection rule handles values, text, dates, and NULL. For numeric processing, the operations "more" or "less" are used, for text processing, the occurrence or non—occurrence of a substring in a string.
The display style is set in the editor. Here you can choose the background fill, color, and text style. For gradient fill, you need to set "Fill color 1" and "Fill Color 2". In addition to conditional selection of cells, you can apply one of four types of selection to all values.

Data presentation
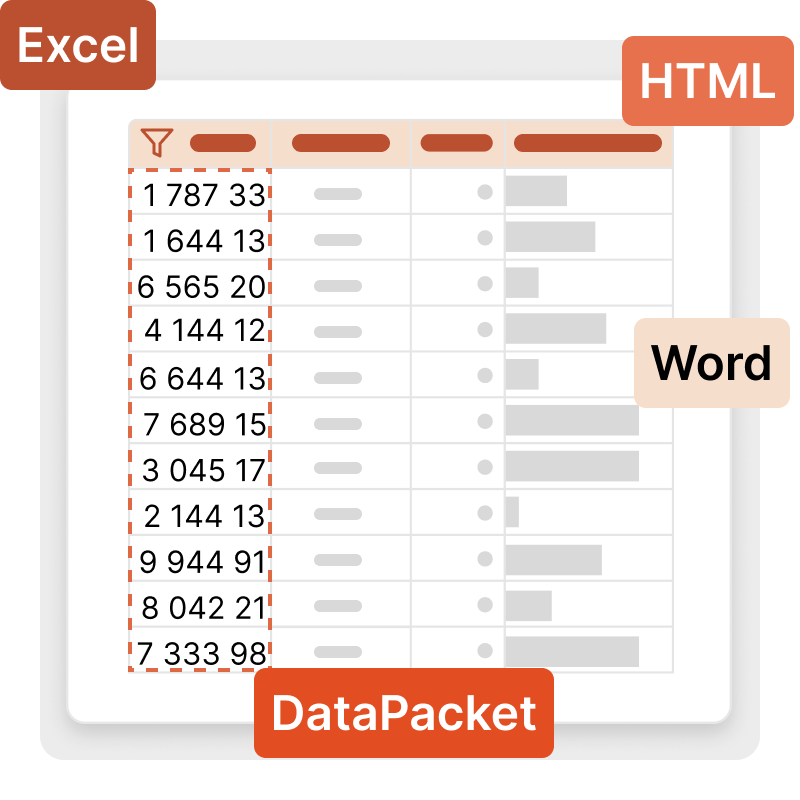
You can export any slices from the OLAP cube to the following formats: Excel and Word (XLS, XML, XML for Analysis, xml-msdata, ms rowset, DataPacket compatible with Embarcadero's ClientDataset), as well as HTML (table and Excel Worksheet HTML).
Flexible component settings will allow you to choose features such as: repeating axis values for each row/column, selecting the output file to display the grid, and much more.

FastScript formulas
Analysis VCL uses FastScript to perform non-standard calculations. Using scripts, you can calculate indicators and filters. You can set data processing after or simultaneously with standard indicators.
For indicators, you can set filters specified by the script. This filter is used if it is necessary to calculate indicators not for all rows of the original data set, but only for selected ones. The calculation filter can be applied to both measures based on standard aggregate functions and calculated measures.
Ultimate VCL
This set of components is part of the Ultimate solution, with which you can create your business projects on all familiar VCL, Lazarus, and FMX platforms. Additionally, the package includes FastScript for fast processing of scripts of any complexity, as well as the visual SQL query builder FastQueryBuilder. In addition, you will have access to client-server reporting tools on VCL and Lazarus.
Delivery options
| Features |
from $1,299
|
from $899
|
from $399
|
|---|---|---|---|
| FastReport Engine |
|
|
|
| VCL components |
|
|
|
| FMX components |
|
|
|
| Lazarus components |
|
|
|
| OLAP features |
|
|
|
| OLAP aggregation functions |
|
|
|
| Data connections |
|
|
|
| Reporting features |
|
|
|
| Report objects |
|
|
|
| Barcodes |
|
|
|
| Charts |
|
|
|
| Printing |
|
|
|
| Export in formats |
|
|
|
| Support |
|
|
|
| Source Code |
|
|
|
| Convertors from |
|
|
|
| Transports |
|
|
|
