Reporting FMX

A cross-platform set of FMX components for creating documents based on Embarcadero FireMonkey

v. 2025.1.4

What reports can Reporting FMX do?

Practically any: invoices, financial reports, product catalogs with color profile support, restaurant menus, sales details, questionnaires with electronic forms, airline tickets, utility bills, and much more. If you have data that needs to be made visually understandable, FastReport is the perfect solution for you.

Features and Benefits Reporting FMX
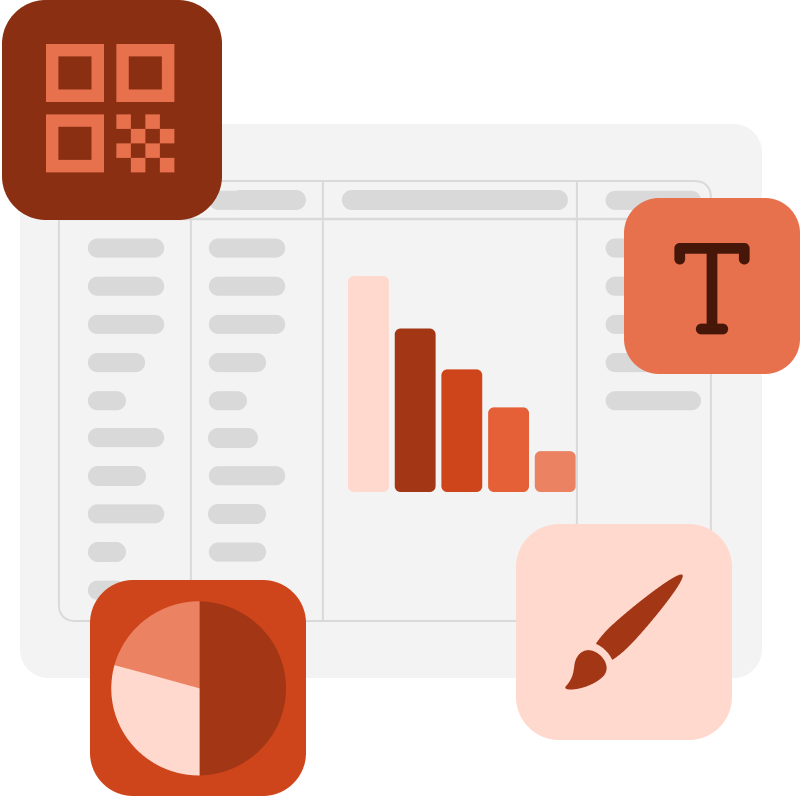
Lots of components
A variety of elements are available for building reports in the designer: from text and images to mathematical formulas and 3D diagrams.
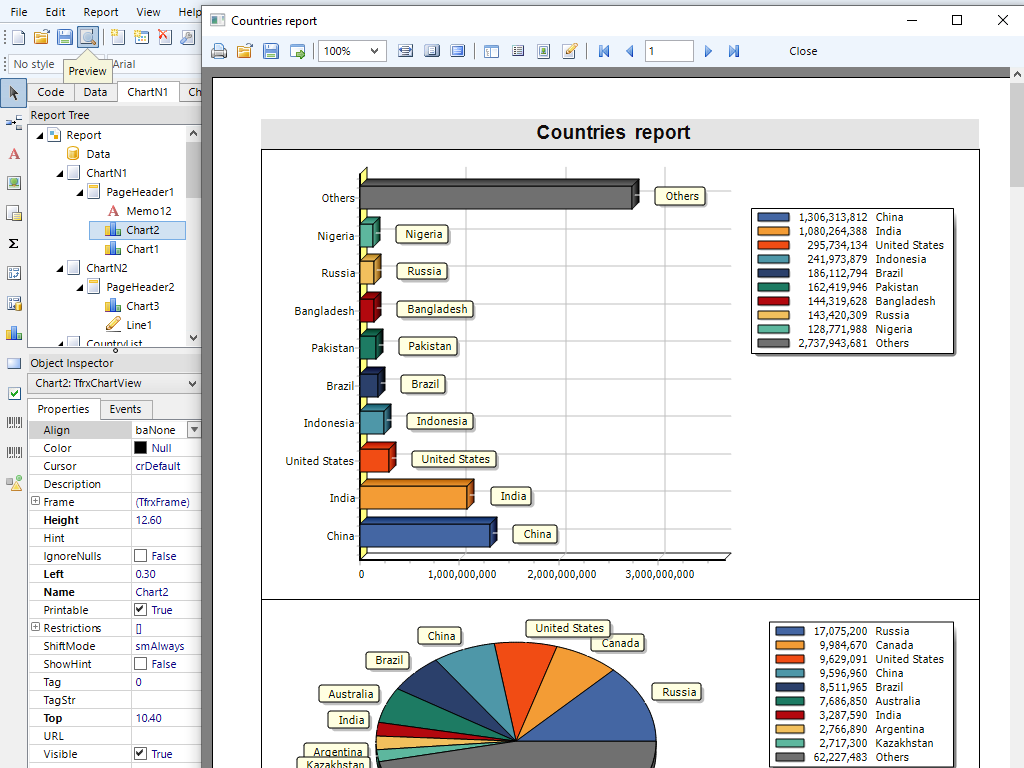
Quick access to the report and data structure
From the report tree and properties tree, you can edit the report structure, parameters, and filters, as well as data sources with global styles.
Safety
Protect your templates and reports with strong data encryption. Adapt all source codes to suit your solutions.
Source code
This set of components includes FastReport source codes. Maximum convenience for companies wishing to adapt the code to their needs.
Flexible and open architecture
If FastReport's functionality is not enough for you, you can improve it by creating and connecting your objects (export filters, databases) to your reports.
Graphics core
For creating graphical elements, rendering text, and managing graphic images, GDI+, D2D, and, of course, Quartz can be used.

The template designer in your application

A powerful modern editor includes a large set of tools for visual design and modification of report templates. Our flexible architecture allows you to create your editors for both existing objects and new ones. A template designer can be included in your application to provide users with their report design. Localization is supported for more than 30 popular languages of the world.

Reporting FMX is a band-oriented report generator. A rich set of bands allows you to build reports of any type: list, master-detail, report with grouping, multi-column, master-detail-detail, and others. If you need to create many reports that contain the same elements (header, footer, company details, logos), then you can collect common elements into a base report and inherit all other reports from it. We also support subreports.

The template designer in your application

Data processing

Reporting FMX supports data sorting and filtering, master-detail relationships. Everything can be configured with a few clicks. It is possible to connect to FireDAC, ADO, DBX, and IBX, thus providing access to almost all databases, including Oracle and many third-party libraries.

Your report may contain data (tables, queries, database connections). This way, you can not only use the data available in your application but also independently connect to any database directly from the report. Reporting FMX contains a script engine that supports PascalScript, C++ Script, BasicScript, and JScript.

The report may contain dialog forms to request parameters before the report is built. Dialog controls support the ability to connect to data and then filter it. Filtering can be added to absolutely any report; it does not require writing any code.

Data processing

Preview and print

The pre-prepared report can be examined in detail in the Report Viewer's preview window. Our component supports working with parameters, multi-level detailing, and interactive reports. You can define the reaction to a mouse click on an object in the preview window. For example, you can build and display another report that shows detailed information about the object the user clicked on.

Additional printing settings. The following options are available to you: cutting large report pages into small ones, printing several small pages on one large page, and printing in a given format with scaling. Do you need to print a report containing A3 pages on a regular A4 printer? Now, this is not a problem!

Preview and print

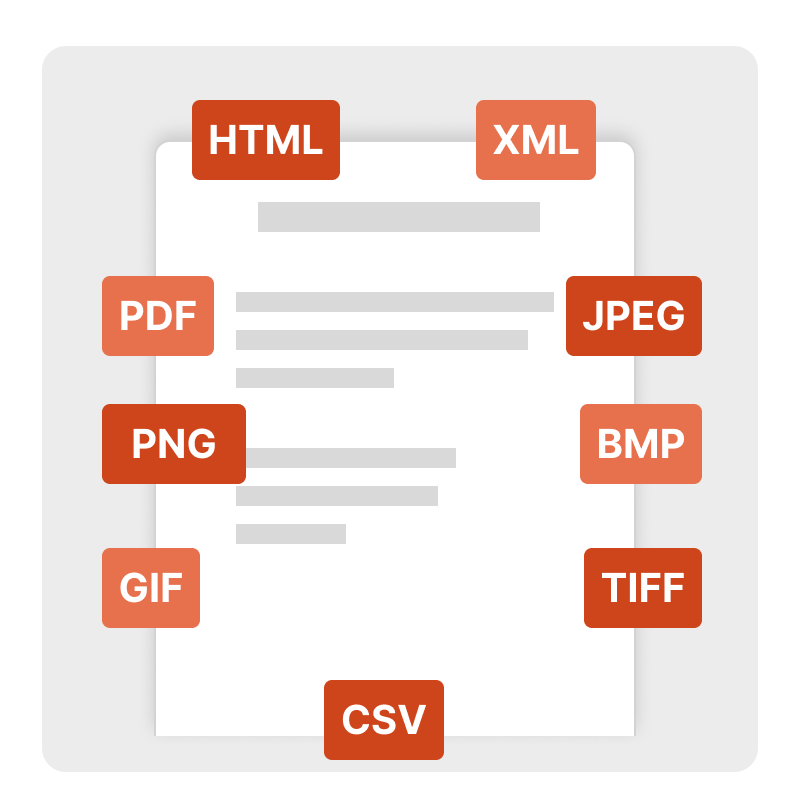
Exports to convenient formats

Filters for exporting the finished report to many formats: PDF, RTF, XLSX, XML, DOCX, TXT, CSV, Excel OLE, PowerPoint, HTML, MHT, XPS, JPEG, BMP, PNG, Open Document Format (ODT, ODS, ODP), XAML, Scalable Vector Graphics (SVG), ZPL, etc.

Reporting FMX allows you to quickly convert reports with editable fields (such as text fields, combo boxes, checkboxes, radio buttons, and graphics fields) into PDF documents without connecting additional libraries.

Exports to convenient formats

Ultimate VCL

This set of components is part of the Ultimate solution, with which you can create your business projects on all familiar VCL, Lazarus, and FMX platforms. Additionally, the package includes FastScript for fast processing of scripts of any complexity, as well as the visual SQL query builder FastQueryBuilder. In addition, you will have access to client-server reporting tools on VCL and Lazarus.

Delivery options

Features
from $1,299
from $899
from $499
from $499
FastReport Engine
VCL components
FMX components
Lazarus components
OLAP features
OLAP aggregation functions
Data connections
Reporting features
Report objects
Barcodes
Charts
Printing
Export in formats
Source Code
Convertors from
Transports

Resent articles

October 15, 2021

Report with two data levels (master-detail) in Delphi/Lazarus by the example of FastReport VCL / FMX

In this article I would like to tell you about such a powerful opportunity of FastReport as multilevel reports. Their structure can be compared to a tree – a trunk, large branches, thinner branches growing from them, and so on up to leaves – or with a company structure: divisions, subdivisions, employees. They are often called master-detail or master-subordinate and consist of several tables. One table contains a list of the main entities; another table bound with the first one contains a list of subordinate entities with a reference to the first table specifying which entity from the first table a certain entity from the second one is subordinate to, and so on. FastReport supports nesting of up to six levels (possibly more by using the Nested report object, but this will be described later). In real applications, one rarely has to print reports with large nesting of data; usually, 1–3 levels are enough. An example of building a master-detail report Let us consider creation of a two-level report. It will contain data from Customer and Orders tables. The first table is a list of customers; the second is a list of orders made by the customers. The tables contain the data of the following types: Customer: CustNo       Company1221          Kauai Dive Shoppe1231          Unisco1351          Sight Diver Orders: OrderNo       CustNo       SaleDate1003            1351          12.04.19881023            1221          01.07.19881052            1351          06.01.19891055            1351          04.02.19891060            1231          28.02.19891123            1221          24.08.1993 As one can see, the second table contains a list of all orders made by all companies. To get a list of orders made by a specific company, on should select the data from the table, for which the field CustNo is equal to the number of the selected company. The report built with these data will look like this: 1221       Kauai Dive Shoppe     1023       01.07.1988     1123       24.08.19931231       Unisco     1060       28.02.19891351       Sight Diver     1003       12.04.1988     1052       06.01.1989     1055       04.02.1989 Now we start making a report. We create a new project in Delphi and set for a form two TTable components, a TDataSource component, two TfrxDBDataSet components, and one TfrxReport component. Connecting data from the base to the report objects We set the components as follows: Table1: DatabaseName = 'DBDEMOS' TableName = 'Customer.db' Table2: DatabaseName = 'DBDEMOS' TableName = 'Orders.db'   DataSource1: DataSet = Table1   frxDBDataSet1: DataSet = Table1 UserName = 'Customers'   frxDBDataSet2: DataSet = Table2 UserName = 'Orders'   In the report designer, we connect our data sources in the Report|Data… window.  Add the 1st level data (master) and the 2nd level data (detail) bands to the page. From the data panel (on the right), we pull the table fields to the respective bands (master and detail). It will look like this: Attention – the 1st level data band must be located above! If it is located below the 2nd level data band, FastReport will inform of an error when a report is started. After starting we will see that the list of orders is the same for every customer and contains all records from the Orders table. This is because we did not switch on filtration of records in the Orders table. Let us return to our data sources. For the Table 2 component, we set the MasterSource = DataSource1 property. Thus, we set the master-subordinate connection. Now we have to set the condition of records filtration in the subordinate source. To do that, call the editor of the MasterFields property at the Table 2 component: We have to connect two CustNo fields in both sources. To do that, select the CustNo index in the list above, select the fields and click the Add button. The bunch of fields will be relocated into the lower window. After that, close the editor with ОК button. When a report is launched, FastReport will do the following. It will select the next recording from the main table (Customer) and set the filter to the subordinate table (Orders). Only the recordings which satisfy the condition Orders.CustNo = Customer.CustNo will be left in the table. That is, for each customer only the orders of that customer will be shown: Similarly, you may build reports with up to six data levels.
Read
January 25, 2021

How to install and use FastReport FMX 2.8 for FmxLinux

Recently we've released FastReport FMX 2.8 which includes support of FMXLinux framework. In this article I'd like to describe installation process and requirements based on trial version of FastReport FMX 2.8, Embarcadero RAD Studio 10.4.1, FmxLinux 1.52 from GetIT package manager and Ubuntu 20.04.1. We won't go deep inside installation and compilation process for Linux under RAD Studio. There are already good articles on Embarcadero website about it: Linux Application Development and FireMonkey for Linux. Here is a short check-list of steps which should be made before installation of FastReport FMX 2.8 (If you have already made a setup of RAD Studio IDE and compiler for Linux and FmxLinux application compiles successfully, just skip these steps):  Install Linux distribution or use installed one (This article based on Ubuntu 20.04.1 distribution ); Install dev packages of gcc and curl. Embarcadero recommends do it through: 1 sudo apt install joe wget p7zip-full curl openssh-server build-essential zlib1g-dev libcurl4-gnutls-dev libncurses5 In this case dev package of 7zip installs all dependencies includes gcc (binary files of trial version FastReport FMX 2.8 builds with gcc 9 !); Install dev packages of zlib. For Ubuntu it should be: 1 sudo apt-get install zlib1g-dev Install x11, gtk3 dependencies packages through: 1 sudo apt install libgl1-mesa-glx libglu1-mesa libgtk-3-common libgstreamer1.0-0 libgstreamer-plugins-base1.0-0 I made a clean installation on new virtual machine and join all installation commands to one:  1 sudo apt install joe wget p7zip-full curl openssh-server build-essential zlib1g-dev libcurl4-gnutls-dev libncurses5 zlib1g-dev libgl1-mesa-glx libglu1-mesa libgtk-3-common libgstreamer1.0-0 libgstreamer-plugins-base1.0-0    Install PAServer(check Linux Application Development);  Install FmxLinux through GetIt package manager (Tools > GetIt Package Manager);   Connect to Linux machine and download SDK.   Installation of FastReport FMX 2.8 for FmxLinux is the same as for the usual FastReport FMX 2 installation. It needs to download installation, for example trial version from here and close developer environment. All paths for compiler installation add automatically. That's it. FastReport FMX 2.8 is ready to be used! Now we can check how FastReport FMX works on Linux. Let's run IDE(in my case Embarcadero RAD Studio 10.4.1) and open a demo example with reports. The Main demo example can be found in installation folder of FastReport FMX 2 by default in C:\Program Files (x86)\FastReport FMX 2 Trial\Demos\Main.Open the project and select platform. Before running the demo application we need to check that all files required for the demo application will be sent via PAServer (Project>Deployment). In my case one checkbox in front of MIDAS library is missing. Just make sure it's selected for the used platform. It's time to compile and run the demo application. Now we can select a report and run the report designer. Build a report and show it in the preview window. And, of course, we can make an export to available formats. Just like for other platforms it's possible to use recompile utility for language change and recompilation of binary files. It's necessary to select path to FmxLinux libraries (by default C:\Users\Public\Documents\Embarcadero\Studio\21.0\CatalogRepository\FmxLinux-1.52\lib\Release for Embarcadero RAD Studio 10.4.1), compiler version, gcc version, and FastReport version. It's important to notice that recompile uses SDK paths from IDE Registry, that's why Linux SDK should be already properly set from RAD Studio before start to use recompile. Let's change a language. Compile and run the demo application again. Language was changed. As we can see, installing and using FastReport FMX 2.8 for FmxLinux is quite simple.
Read
Fast Reports
  • 800-985-8986 (English, US)
  • +4930568373928 (German)
  • +55 19 98147-8148 (Portuguese)
  • info@fast-report.com
  • 66 Canal Center Plaza, Ste 505, Alexandria, VA 22314

© 1998-2025 Fast Reports Inc.