FastReport Desktop

A standalone software product for creating and automating report generation

v. 2025.1.21

What reports can FastReport Desktop do?

Practically any: invoices, financial reports, product catalogs with color profile support, restaurant menus, sales details, questionnaires with electronic forms, airline tickets, utility bills, and much more. If you have data that needs to be made visually understandable, FastReport is the perfect solution for you.

Features and Benefits FastReport Desktop

Low-code solution
We wrote all the code for you. FastReport Desktop does not require programming skills and is suitable even for inexperienced users.
Lots of components
A variety of elements are available for building reports in the designer: from text and images to mathematical formulas and 3D diagrams.
Quick access to the report and data structure
From the report tree and properties tree, you can edit the report structure, parameters, and filters, as well as data sources with global styles.
Compatibility and integration
FastReport Desktop is part of the unified FastReport platform in C#. In FastReport Cloud, you can store your templates, reports, and data sources and then use them in the desktop designer.
Smooth transition from other solutions
Our report generator instantly converts your reports from List&Label, DevExpress, Microsoft Reporting Services (RDL, RDLC), Crystal Reports, StimulSoft, and Jasper Library into FastReport format.
Available documentation
Take advantage of our documentation, free video tutorials, and numerous articles for every usage scenario of our product in your projects to achieve meaningful results in the shortest possible time.
How to set this up?

How to set this up?

Step 1: Create a report template and connect it to a database in the report designer.

Step 2: Specify the actions you would like to perform on the report. Do you want to export to PDF? Or perhaps Excel? Send it by email or print it? Anything you'd like!

Step 3: Schedule the task. Choose the day and time when you want to see the finished report on your desk.

Step 4: Have a cup of coffee. Your work is now done.

What does the product consist of?

What does the product consist of?

With the purchase of this product, you will receive:

  1. Visual designer for creating and editing reports.
  2. Builder in the form of a console utility for building and processing reports.
  3. GUI configurator for creating builder tasks.
  4. A convenient scheduler for completing tasks on a schedule.
  5. Viewer for displaying and printing ready-made reports.

What can the designer do?

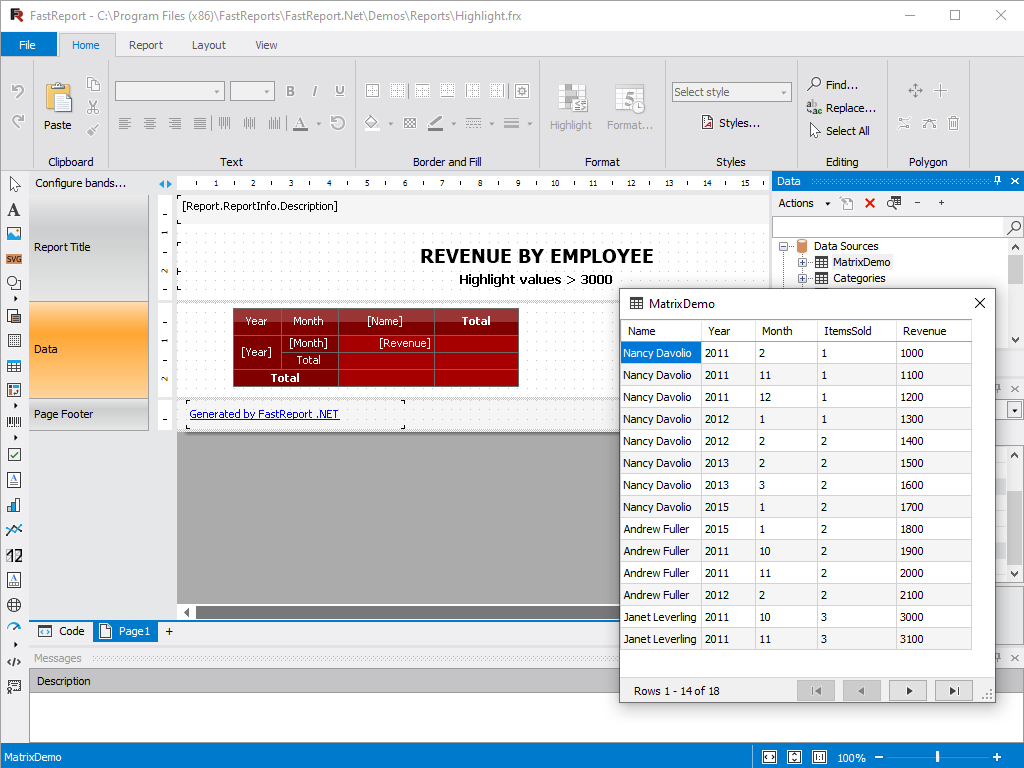
Report Designer allows developers and users to create, design, edit, view, save, export, and print custom reports without much hassle.

FastReport Desktop works stand-alone without integration into Visual Studio, and it also supports scaling, undo/redo buffers, extension lines, and rulers. The designer can be used at run-time. This will allow your users to independently edit existing documents and create new ones. The designer can also be used in MDI (Multi-Document Interface) mode to work with several reports simultaneously.

Available objects: Text, Picture, Shape, Line, Subreports, Table, Matrix, Barcode, Graphs, Maps, RichText, Checkbox, Postal code, Text in cells, Exports in 40+ formats, Dialog forms, Data sources, Runtime Report Designer, Report script, Saving templates in clouds.

Localization is supported for more than 40 popular languages of the world.

What can the designer do?


Are these reports safe?

Protecting your analyzed data is very important to us. We offer you 3 ways to increase document confidentiality.

Method 1. In the "Security" tab, specify a password that will be requested when opening the report. The report with the password is saved in encoded form, so don't forget your password! It will be almost impossible to recover the report in this case.

Method 2. Increase the security of your data by using your encryption key. In this case, the report file can only be opened correctly in your program.

Method 3. Apply additional report settings to grant permission to print the document, make changes to the document, and copy text and graphics from the document.

Are these reports safe?


How does the schedule work?

You can set up receiving reports every day, week, or month with a detailed analysis of all information. FastReport Desktop is great for building quarterly reports, monthly sales analysis, and daily generation of payment documents.

Adapt the schedule to suit your needs. Schedule reports to run only when your computer starts. Or enable automatic report generation when you log in.

The ready-made files can be saved locally and downloaded with a mouse click. They can also be sent for printing upon completion of the generation process and uploaded to cloud storage such as OneDrive, Dropbox, Google Drive, Box, E-Mail, and FTP.

How does the schedule work?


Why FastReport Desktop?

You can turn your data into visual information. Create a report, connect to a database, and use graphs to make business decisions. FastReport Desktop will be an excellent replacement for the outdated FastReport Studio solution.

Compatible databases: MS SQL, Oracle, PostgreSQL, MySQL, MongoDB, Firebird SQL, RavenDB, Couchbase, XML, JSON, CSV, SQLite, OLE DB, ODBC.

Export formats: PDF, PDF/A, PDF/X, RTF, Excel 2007, Excel 97, Word 2007, PowerPoint 2007, Open Office Calc, Open Office Writer, XML, XAML, HTML, MHT, BMP, PNG, GIF, JPEG, TIFF, EMF, SVG, CSV, DBF, JSON, Text, ZPL, PPML, PostScript, XPS, LaTeX.

Low-code — we wrote all the code for you. FastReport Desktop does not require programming skills and is suitable even for inexperienced users. The interface contains simple logic and drag-and-drop functions instead of various programming languages. Detailed documentation will simplify the process of mastering the system and connecting it to your IT solutions.

Suitable for installation on the Windows operating system.

Why FastReport Desktop?


Delivery options

Features
from $999
Buy
from $399
Buy
Get
Common component interface
Report manager
Applications
FastReport Engine
Data connections
Reporting features
Report objects
Barcodes
Charts
Printing
Export to formats
Transports
Convertors from

Resent articles

March 25, 2025

How to Merge Multiple Reports into One in FastReport .NET

FastReport .NET is a powerful tool for creating and managing reports, widely used in various fields. It provides developers with the ability to create complex and professional reports using a multitude of features and capabilities. One of the key features of FastReport .NET is the ability to merge multiple reports into one. This can be useful where you need to combine data from different sources or present information in a more convenient format. In this article, we will discuss how to merge multiple reports into one in FastReport .NET. Open the FastReport .NET report designer and load your report.   Once the designer is open, select the “File” menu and then “Open Page.”   In the file system, select the report that you want to merge with the first one and load it.   Now, choose the required page and click OK. Starting from FastReport .NET version 2025.1, you can enable the “Add as Link” option, which means that the report will include a link to the page rather than a copy of it. This means that if the page is changed in the original report, the changes will be reflected in all reports where the page has been added as a link. Conversely, if the page is modified in one of the reports that link to it, it will be changed in the original report as well.   If everything went successfully, you will have access to the added pages from the selected template at the bottom of the designer.   To merge them into a single report, you can save the current modified template, or save it as a new template. To do this, select the “File” menu and then “Save As.” Save the new report under a new name.   In this article, we have covered in detail how to merge several reports into one in FastReport .NET. We explored the main tools and methods that FastReport .NET provides for merging reports, as well as how to use them effectively.
Read
March 11, 2025

How to Use FastReport .NET Avalonia on Fedora Workstation with Wayland Protocol

Wayland is a protocol designed to manage a graphical server in Linux-based operating systems and other UNIX-like OS. Avalonia UI is a framework based on .NET, actively used for developing cross-platform user interfaces. With a universal API for building applications, Avalonia supports all major platforms and runtime environments and has its unique interface. This way, your business solutions will look identical across every operating system. FastReport .NET Avalonia includes a powerful data processing core, a familiar report designer, and a viewer for finished reports. The new product also offers all export formats for the generated report — PDF, Excel, MS Word, and many others. In this article, we will discuss how to run FastReport .NET Avalonia on the "Fedora Workstation 39" operating system with Wayland protocol.     Main Differences Between Wayland and X11 In the Wayland protocol, versions permeate it from top to bottom. Each interface has a specific version, and each protocol object implements a specific version of its interface. This eliminates the possibility of version conflicts that exist in X, as version negotiation is tied to the connection rather than to the clients. Unlike X11, in Wayland, it is possible to precisely determine which version of an extension an application receives. Working with input devices in Wayland is similar to Xinput 2.2, but without the outdated code clutter and Master/Slave relationships between input devices. The global object seat defines a group of input devices, including a mouse, keyboard, and touchscreen. Unlike X, Wayland does not have an API for rendering and does not deal with creating graphical images. Its role is to manage buffers containing client pixels in such a way that application A does not make unwanted changes to the buffers of application B. Clients determine which pixels will be in the buffers and are responsible for the image that is displayed on the screen!     Installation of Required Software We need to update the indices, as well as install .NET 6.0 for further work. Open the console and enter the following commands: sudo dnf update sudo dnf install dotnet-sdk-6.0 After that, download the FastReport .NET Avalonia Trial library for Linux from the Fast Reports Inc. website. Next, extract the FastReport.Avalonia.LinuxDemo.zip archive into a convenient directory.     Running FastReport .NET Avalonia Open the terminal and navigate to the directory where you extracted the FastReport .NET Avalonia Trial application, and then enter the linux-x64 folder.   To run the FastReport .NET Avalonia Trial, we need to enter the following command in the terminal: dotnet AvaloniaDemo.dll After that, you will be able to view the demonstration report of FastReport .NET Avalonia.   It's time to go to the report designer. To do this, click on the "Designer" button in the upper panel of the demo application.   Thus, we have managed to run FastReport .NET Avalonia on the "Fedora Workstation 39" operating system with the Wayland protocol. There is nothing complicated about launching and setting up the connection. It is enough to install the SDK packages and unpack the archive with the application, after which you can use the report designer. For any questions, please contact our technical support at support@fast-report.com. Enjoy using it!
Read
March 07, 2025

How to Create a QR Code with an Image in FastReport .NET

QR codes are becoming increasingly popular tools for storing and sharing information. In reports and documents, they can be used for quick access to websites, contacts, product information, and much more. FastReport .NET is a powerful library for creating reports in .NET applications. It allows not only the generation of text and graphic reports but also the integration of dynamic elements such as QR codes. In this article, we will explore how to create a QR code with an image in FastReport .NET to enhance the visual representation of reports and improve their functionality. First, we need to create a regular QR Code in the designer. To do this, go to the components panel and select “Barcode” > “2D” > “QR Code.”   After placing our QR Code, we go to its properties and set the ErrorCorrection property to H.     This property is responsible for error correction using Reed-Solomon code. It can take values: L (low—7%), M (medium—15%), Q (25%), H (high—30%). By default, it is set to L. The redundancy (ErrorCorrection) is necessary for correctly reading the data when the image of the code is partially damaged or when an image is placed over it. Next, we will create a PictureObject in which we will place our image with the logo.     Now we can place our image directly on the QR Code. Reading will function correctly.     So, we have figured out how to insert an image into our QR Code. The FastReport designer allows you to do this easily in just a few clicks. We can use this feature, for example, to link to the official website via phone, so clients know which QR code will lead them there just by looking at the image. For any questions, you can contact our support team. Enjoy using the tool!
Read
Fast Reports
  • 800-985-8986 (English, US)
  • +31 97 01025-8466 (English, EU)
  • +49 30 56837-3928 (German, DE)
  • +55 19 98147-8148 (Portuguese, BR)
  • info@fast-report.com
  • 66 Canal Center Plaza, Ste 505, Alexandria, VA 22314

© 1998-2025 Fast Reports Inc.