Using the “Engine” object
We have already said that the “Engine” object represents the report's engine, which manages report construction. The process of arranging band(s) on a page can be managed by using the engine's properties and methods. First some theory.
The diagram below shows various dimensions of the report page.

The physical dimensions of the page are the PaperWidth and PaperHeight properties, visible in the object inspector when the page is selected. So the size of an A4 page is 210 x 297mm.
PageWidth and PageHeight are the dimensions of the printable region, which is usually less than the physical dimensions of the page. The size of the printable region is dependent on the report page properties LeftMargin, TopMargin, RightMargin and BottomMargin. The printable region’s size in pixels is returned by the Engine.PageWidth and Engine.PageHeight functions.
Finally, FreeSpace is the height of the free space on a page. If there is a "Page Footer" band on the page, its height is taken into account when calculating the FreeSpace. This height is returned in pixels by the Engine.FreeSpace function.
Note that after displaying the next band the free space is reduced on the page, this is taken into account when calculating the
FreeSpace.
How are report pages constructed? The FastReport core displays bands on a page as long as there is enough free space. When there is no more free space left the “Page Footer" band is printed (if required) and a new blank page is created.
As already said, after displaying the next band the height of free space is reduced. Moreover, display of the next band begins from the current position, which is defined by coordinates on the X-axis and the Y-axis.
The current position is returned by
Engine.CurXandEngine.CurYrespectively.
After printing the next band, CurY automatically increases by the height of the printed band. After a new page is created CurY equals 0. CurX is changed when printing multi-column reports.
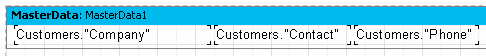
Engine.CurX and Engine.CurY are available not only for reading but also for writing. This means that bands can be shifted by incrementing or decrementing these values. For example, in a report resembling this:
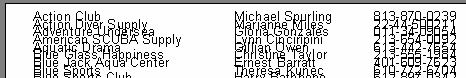
it can be printed in the following way:

This is achieved by writing a handler for the band's “OnBeforePrint” event:
PascalScript:
procedure MasterData1OnBeforePrint(Sender: TfrxComponent);
begin
  Engine.CurX := Engine.CurX + 5;
end;
C++ Script:
void MasterData1OnBeforePrint(TfrxComponent Sender)
{
  Engine.CurX = Engine.CurX + 5;
}
Changing CurY can make bands overlap, for example:
Achieved by this script:
PascalScript:
procedure MasterData1OnBeforePrint(Sender: TfrxComponent);
begin
  Engine.CurY := Engine.CurY - 15;
end;
C++ Script:
void MasterData1OnBeforePrint(TfrxComponent Sender)
{
  Engine.CurY = Engine.CurY - 15;
}
The Engine.NewPage method inserts a page break at any required point in a report, following which printing continues from the top of the new output page. In our example a break can be inserted after printing the second record:
PascalScript:
procedure MasterData1OnAfterPrint(Sender: TfrxComponent);
begin
  if <Line> = 2 then
    Engine.NewPage;
end;
C++ Script:
void MasterData1OnAfterPrint(TfrxComponent Sender)
{
  if (<Line> == 2)
    Engine.NewPage();
}
Note that we used the “OnAfterPrint” event (that is to say, after the band has been printed). Also note that the Line system variable returns the sequential number of the record.
The Engine.NewColumn method inserts a column break in multi-columned reports. If there are no more free columns left on the page then a new page is created.