Designer
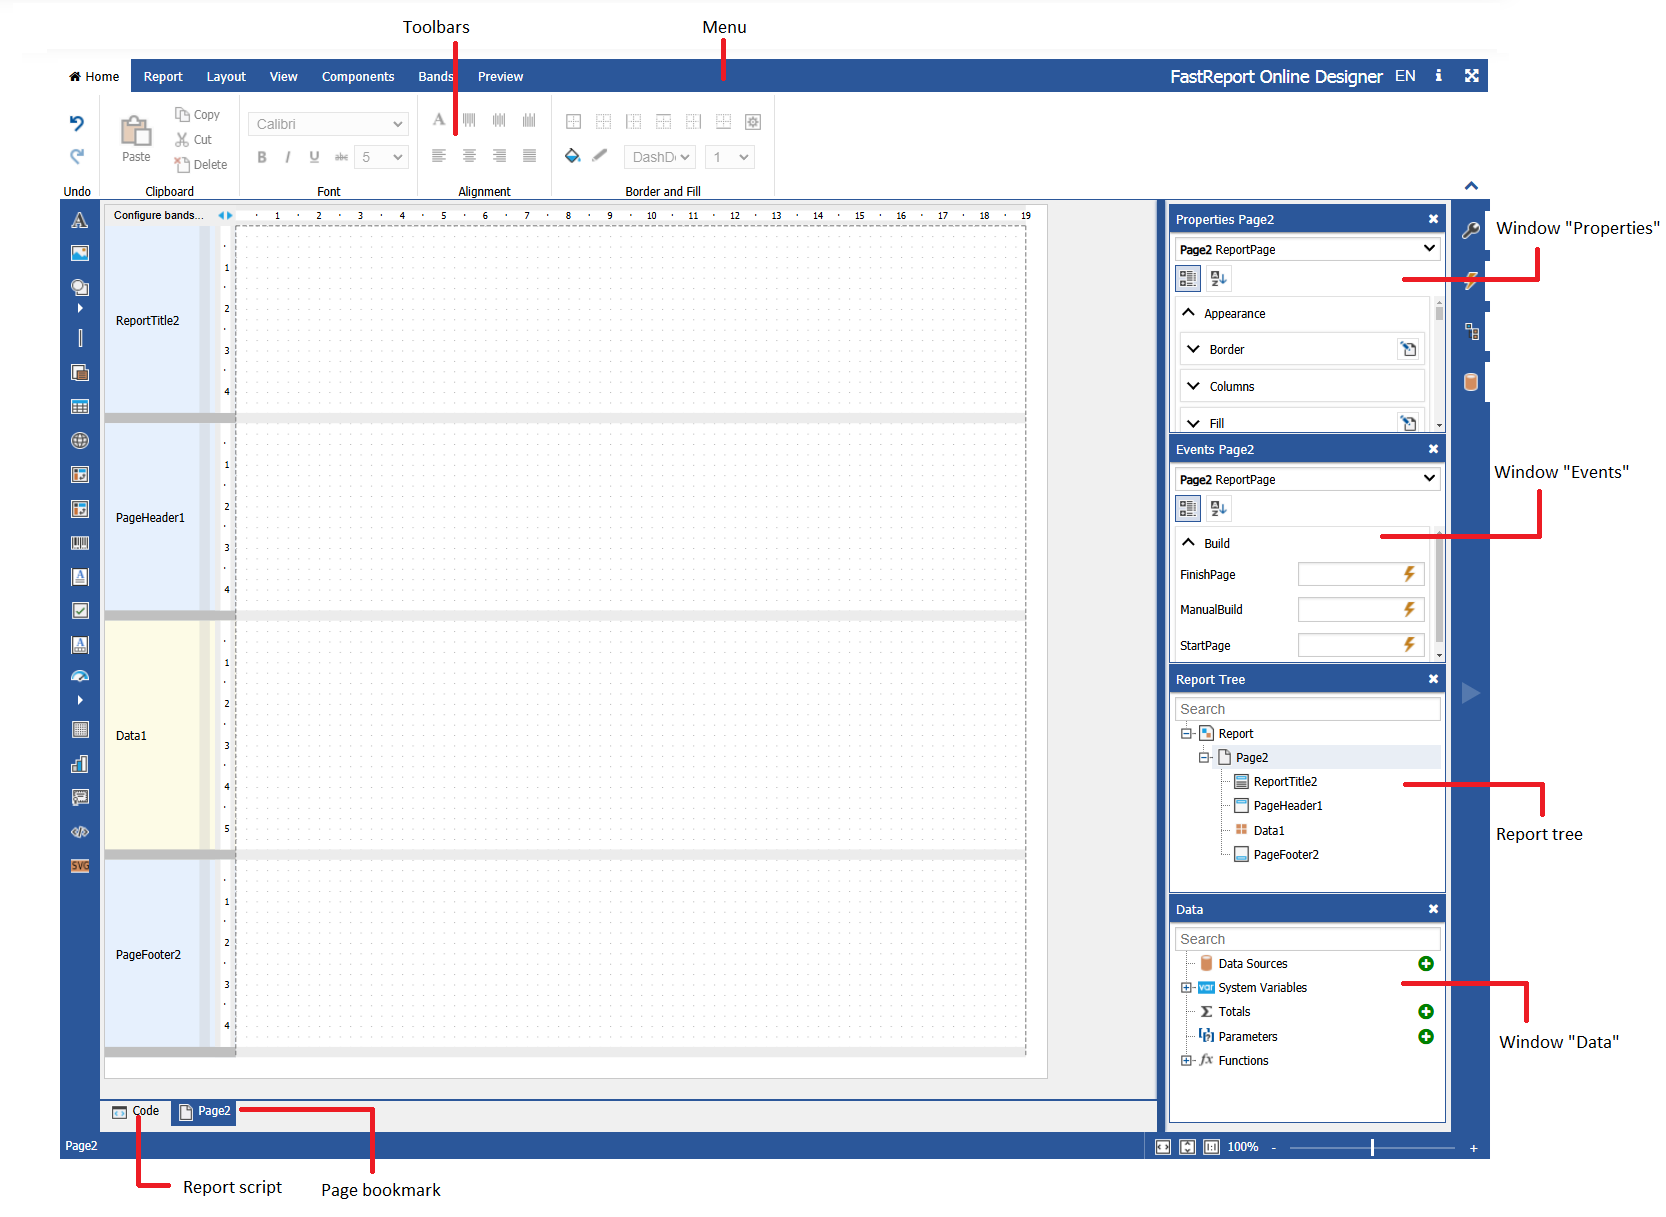
Let’s consider the structure of the interface of FastReport Online Designer. There are the following areas:
- menu;
- report page;
- "Properties" window;
- "Events" window;
- report tree;
- "Data" window;
- toolbar;
- pages tabs;
- report script.

Let us examine each item.
Main menu is placed at the top of the report designer: Main, Report, View, Components, Bands. When we select the menu item, we open the tab with toolbars, similar to Microsoft Office 2007.
The toolbar of the Main tab is used to change the appearance of the report components.
On the "Report" tab you can save the report, add/delete page, add dialog, and run the report in preview mode.
On the tab “View”, you can specify settings for the grid of a report page. The grid helps to position components in accordance with each other.
The “Components” tab contains the FastReport component palette. Components allow you to display different data in the bands. They are an integral part of the report template along with the bands.
The tab "Bands" contains a palette of bands that can be added to the report. The bands represent a container for placing components. The type of band determines its location in the report.
Report page contains the bands and components that make up a report template.
The Properties window is hidden by default, like the other windows. It can be enabled by using the icon on the sidebar. So you can include the "opening Event", the tree report and the "Data" window. For convenience the open windows can be moved anywhere on the screen. To return the window to its original position click on the pin icon in the header.
The “Properties” window displays the properties of the selected report object (such as band, component, or a report page).
The "Events" shows the events available for the selected report object.
The report tree contains all report objects in a hierarchical list. By the right-click on items in the list you can call the context menu for the selected object.
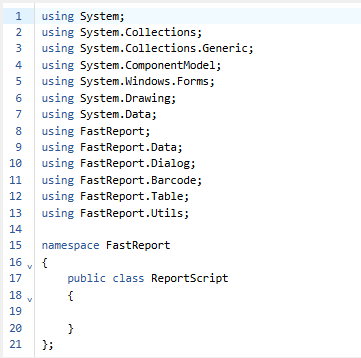
At the bottom of the report designer you can see the tabs that represents report pages, as well as the icon of the report script. If you use the script, the code editor opens instead of the report page:

The report script allows the user to define the logic of the report.