v. 2025.1.8

Analysis VCL instantly processes arrays and transforms database information into compact and generalized reports. Integrate the OLAP library into your project, prepare the data (or several sets) that your users will need for analysis, and get BI in your application.

Cross table

Cross table

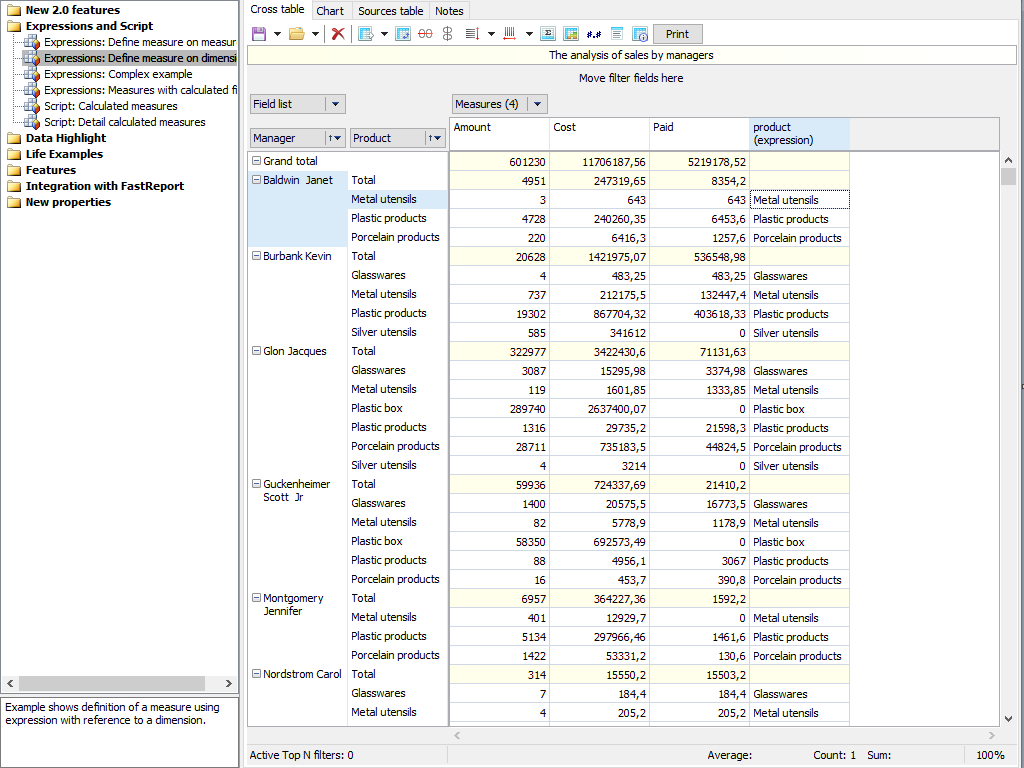
The Analysis VCL consists of a cross-table—an interactive tool for data presentation and analysis. In the upper and left parts of the table, there are multi-level headers filled with the values of the dimensions. The central part of the table displays the values of the indicators.

The cross-table consists of many areas: the header of the cross-table, the area of the filter fields, the vertical and horizontal headers of the dimensions, the vertical and horizontal header of the cross-table, the data area, the field list, the list of Top-N filters, the area of aggregate calculations for the selected cells, and scale control.

Sorting

Sorting

The data in the cross-table is displayed in a strictly sorted order, regardless of their original order in the source data. The sorting order can be either ascending or descending. For numeric and time-based values, the order means their natural order of succession. For string values, the alphabetical order of succession is applied.

Each dimension of the cross-table can have its sorting order of values. By default, ascending sorting is applied. You can change the sorting order of a dimension by double-clicking on the dimension header or selecting an option in the context menu.

Características e benefícios Analysis VCL

Embedding in the interface
Full customization and integration into the interface of your business application.
Data sources
Connection to databases takes place not only through standard ADO and BDE components but also through any built based on TDataSet.
Visual results
To create graphs and charts based on table slices, you can use TeeChart (both from RAD Studio and the commercial edition of TeeChart Pro).
Global filter
Use one data cube for synchronous analysis based on various criteria, built on independent filters.
Graphics core
GDI is used to create graphic elements, render text, and manage graphics.
Source code
This set of components includes source codes. Maximum convenience for companies wishing to adapt the code to their needs.
Conditional data selection

Conditional data selection

The cross-table allows you to set the display style for certain metric values. You can select data within a certain range or beyond its boundaries. The selection rule handles values, text, dates, and NULL. For numeric processing, the operations "more" or "less" are used, for text processing, the occurrence or non—occurrence of a substring in a string.

The display style is set in the editor. Here you can choose the background fill, color, and text style. For gradient fill, you need to set "Fill color 1" and "Fill Color 2". In addition to conditional selection of cells, you can apply one of four types of selection to all values.

Data presentation

Data presentation

You can export any slices from the OLAP cube to the following formats: Excel and Word (XLS, XML, XML for Analysis, xml-msdata, ms rowset, DataPacket compatible with Embarcadero's ClientDataset), as well as HTML (table and Excel Worksheet HTML).

Flexible component settings will allow you to choose features such as: repeating axis values for each row/column, selecting the output file to display the grid, and much more.

FastScript formulas

FastScript formulas

Analysis VCL uses FastScript to perform non-standard calculations. Using scripts, you can calculate indicators and filters. You can set data processing after or simultaneously with standard indicators.

For indicators, you can set filters specified by the script. This filter is used if it is necessary to calculate indicators not for all rows of the original data set, but only for selected ones. The calculation filter can be applied to both measures based on standard aggregate functions and calculated measures.

This set of components is part of the Ultimate solution, with which you can create your business projects on all familiar VCL, Lazarus, and FMX platforms. Additionally, the package includes FastScript for fast processing of scripts of any complexity, as well as the visual SQL query builder FastQueryBuilder. In addition, you will have access to client-server reporting tools on VCL and Lazarus.

Opções de entrega

Características
de $ 1.299
de $ 899
de $ 399
FastReport Engine
VCL components
FMX components
Lazarus components
OLAP features
OLAP aggregation functions
Data connections
Reporting features
Report objects
Barcodes
Charts
Printing
Export in formats
Support
Source Code
Convertors from
Transports

Artigos reenviados

06 de outubro de 2021

Como usar filtros e opções de ordenação (classificação) no FastCube VCL

A filtragem de dados é essencial ao trabalhar com informações. É difícil imaginar ferramentas analíticas sem tal opção. Na maioria das vezes, filtros e classificação são usados para: acessar dados rapidamente; tornar dados mais fáceis de usar; edição facilitada de dados; estruturação da informação. Você precisa usar a ferramenta Measure para trabalhar com filtros no FastCube VCL. Depois de clicar com o botão esquerdo do mouse, você verá a seguinte janela: Aqui você pode controlar os dados exibidos usando os botões na parte inferior.  - exibe todas measures (medidas);  - remove todas measures (medidas);  - inverte a ordem dos dados exibidos e não exibidos;  - move a measure (medida) um nível para cima;  - move a measure (medida) um nível abaixo;  - aplica alterações. As capturas de tela abaixo mostram como usar os botões para mover as colunas para cima e para baixo na lista funcionam. Também é possível aplicar a filtragem através do menu measures (medidas. Para fazer isso, clique com o botão direito do mouse no item que deseja filtrar e selecione “Filtrar este item” ou “Filtrar todos os outros itens”. O item que você precisa será filtrado. Agora vamos criar um filtro por condição. Clique com o botão direito do mouse em um dos itens da lista de campos e selecione “criar um filtro personalizado”. O filtro personalizado pode ser configurado no editor de intervalo. Pode incluir vários itens, como no exemplo abaixo. Você precisa clicar no botão do editor de medidas para filtrar os itens de agregação por indicador. Esta captura de tela mostra a janela “geral”, onde a filtragem será aplicada apenas para um item agregado. Neste caso, será o item “soma”. Agora você já conhece as opções de filtragem e classificação disponíveis no ambiente analítico FastCube VCL.
Ler
01 de outubro de 2021

How to use FastCube .NET in React application

UPD: Applies to the versions of FastCube .NET before 2022.1. License packages are now available on our NuGet server. The ReactJs library has become widespread in the web development of single-page applications. Previously we have covered how to display reports and the online report designer in React SPA application. Now it is possible to display cubes and slices of data from FastCube.Core on a web page. Let's consider how to do this. To create an ASP .NET Core app with a React frontend part, you can use a template in the .NET SDK. Run in the command line: dotnet new react -o MyReactApp This command will create a demo application that we can use to display the cube. Of course, for this, you must have the .NET Core SDK installed. In addition, the application will require Node.js. Go to the directory of the created application: cd MyReactApp and install javascript packages using the command: npm install Let's start working with the created web application. First, let’s install the FastCube packages. Open the Nuget package manager. In the upper right corner of the window, you will see a gear icon, which opens the settings of package sources. Click on it and add a new package source - a folder with our FastCube packages, which are located in the C:\Program Files (x86)\FastReports\FastCube.Net Professional\Nuget folder. Select the added package source in the drop-down list and install the packages: We connect FastCube in the Startup.cs file, add the code in the Configure () method: app.UseFastCube(); Our application already contains WeatherForecastController. Let's add our web method to it: [HttpGet("[action]")] public IActionResult ShowCube() { Cube cube = new Cube(); Slice slice = new Slice() { Cube = cube }; FilterManager filterManager = new FilterManager() { Cube = cube }; WebGrid grid; grid = new WebSliceGrid() { Slice = slice };   ViewBag.WebGrid = grid;   cube.SourceType = SourceType.File; cube.Load(Path.Combine("C:\\Users\\FR\\Downloads\\fastcube-net-master\\Demos\\Data\\", "Cubes", "calculated_measures.mdc")); return View(); } The Cube and Slice objects are related because, in fact, the slice is part of the cube. A WebGrid object is used to display an interactive crosstab. It can display both a WebCubeGrid slice and a WebSliceGrid cube. In our example, we loaded the cube that we previously created in the FastCube .NET desktop version. Pay attention to the class from which the controller inherits. It should be Controller, not BaseController. Now let's create a view for this method. This can be done by right-clicking on the ShowCube method signature. The view will contain a single line of the code: @await ViewBag.WebGrid.Render() Now let's move on to SPA application, which is located in the ClientApp folder. We need to add our component to the src->components folder. It will display the iframe with the view we created above. Add the Cube.js file with the following code: import React, { Component } from 'react'; export class Cube extends Component { static getCube() { return { __html: '<iframe width="1000" height="1000" src="weatherforecast/ShowCube" />' }; } render() { return ( < div dangerouslySetInnerHTML={Cube.getCube()} /> ); } } Everything is easy here. We display iframe that refers to a method in the controller. Now you need to add the component to the App.js application structure: import React, { Component } from 'react'; import { Route } from 'react-router'; import { Layout } from './components/Layout'; import { Home } from './components/Home'; import { FetchData } from './components/FetchData'; import { Counter } from './components/Counter'; import { Cube } from './components/Cube';   import './custom.css'   export default class App extends Component { static displayName = App.name;   render () { return ( <Layout> <Route exact path='/' component={Home} /> <Route path='/counter' component={Counter} /> <Route path='/fetch-data' component={FetchData} /> <Route path='/cube' component={Cube} /> </Layout> ); } } In addition, you need to add a new menu item in the NavMenu.js file: import React, { Component } from 'react'; import { Collapse, Container, Navbar, NavbarBrand, NavbarToggler, NavItem, NavLink } from 'reactstrap'; import { Link } from 'react-router-dom'; import './NavMenu.css';   export class NavMenu extends Component { static displayName = NavMenu.name;   constructor (props) { super(props);   this.toggleNavbar = this.toggleNavbar.bind(this); this.state = { collapsed: true }; }   toggleNavbar () { this.setState({ collapsed: !this.state.collapsed }); }   render () { return ( <header> <Navbar className="navbar-expand-sm navbar-toggleable-sm ng-white border-bottom box-shadow mb-3" light> <Container> <NavbarBrand tag={Link} to="/">FastCubeReact</NavbarBrand> <NavbarToggler onClick={this.toggleNavbar} className="mr-2" /> <Collapse className="d-sm-inline-flex flex-sm-row-reverse" isOpen={!this.state.collapsed} navbar> <ul className="navbar-nav flex-grow"> <NavItem> <NavLink tag={Link} className="text-dark" to="/">Home</NavLink> </NavItem> <NavItem> <NavLink tag={Link} className="text-dark" to="/counter">Counter</NavLink> </NavItem> <NavItem> <NavLink tag={Link} className="text-dark" to="/fetch-data">Fetch data</NavLink> </NavItem> <NavItem> <NavLink tag={Link} className="text-dark" to="/cube">Cube</NavLink> </NavItem> </ul> </Collapse> </Container> </Navbar> </header> ); } }   The application is ready. Let's run it: Thus, you can display your web cube using FastCube.NET in a React SPA application.
Ler
Fast Reports
  • 800-985-8986 (English, US)
  • +31 97 01025-8466 (English, EU)
  • +49 30 56837-3928 (German, DE)
  • +55 19 98147-8148 (Portuguese, BR)
  • info@fast-report.com
  • 66 Canal Center Plaza, Ste 505, Alexandria, VA 22314

© 1998-2025 Fast Reports Inc.