v. 2025.2.0

FastCube enables you to analyze data and to build summary tables (data slices) as well as create a variety of reports and graphs both easily and instantly.

Cross table

Cross table

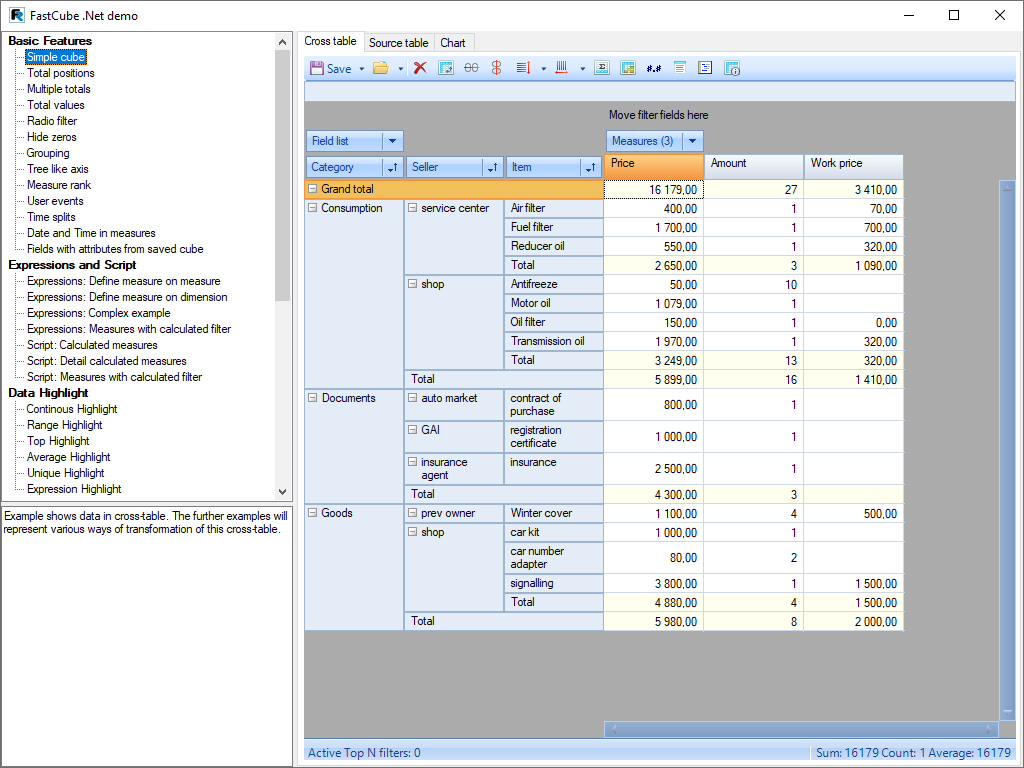
The FastCube .NET consists of a cross-table—an interactive tool for data presentation and analysis. In the upper and left parts of the table, there are multi-level headers filled with the values of the dimensions. The central part of the table displays the values of the indicators. The cross-table consists of many areas: the header of the cross-table, the area of the filter fields, the vertical and horizontal headers of the dimensions, the vertical and horizontal header of the cross-table, the data area, the field list, the list of Top-N filters, the area of aggregate calculations for the selected cells, and scale control.

Download the project on Knockout.js

Sorting FastCube .NET

Sorting

The data in the cross-table is displayed in a strictly sorted order, regardless of their original order in the source data. The sorting order can be either ascending or descending. For numeric and time-based values, the order means their natural order of succession. For string values, the alphabetical order of succession is applied.

Each dimension of the cross-table can have its sorting order of values. By default, ascending sorting is applied. You can change the sorting order of a dimension by double-clicking on the dimension header or selecting an option in the context menu.

Características e benefícios FastCube .NET

Embedding in the interface
Full customization and integration into the interface of your business application.
Global Filter
Use a single data cube for synchronous analysis according to various criteria based on an independent filter.
Source code
This set of components includes FastReport source codes. Maximum convenience for companies wishing to adapt the code to their needs.

Conditional data selection

The cross-table allows you to set a special display style for certain indicator values. For example, you can highlight data that falls within a certain range or goes beyond its boundaries. The highlighting rule allows you to process indicator values as values, text, dates, or NULL. Depending on the type of processing, you can apply different condition options. For processing values, you can use "greater than" and "less than" operations, and for text processing, substring inclusion or exclusion operations are available.

The display style of the condition is set in the editor. You can choose the background fill variant, text color, and text style. For a solid fill, it is enough to set only the "Fill Color 1", and for gradient fills, you also need to specify the "Fill Color 2". In addition to conditional cell highlighting, you can apply one of four types of highlighting to all values. In this case, each cell will be highlighted depending on its value.

Conditional data selection

Data presentation

You can export any slices from the OLAP cube to the following formats: ODS, XLS, XML, HTML. Flexible component settings will allow you to choose features such as: repeating axis values for each row/column, selecting the output file to display the grid, and much more.

Data presentation

This set of components is part of the Ultimate solution, with which you can create your business projects on all modern .NET, ASP.NET, Blazor, WASM, WPF, WinForms, Avalonia UI, Mono, and other platforms. With your team, you can work both in the desktop designer and directly from the browser. The Ultimate package also includes components for data visualization, namely business graphics with a set of charts and OLAP products for fast processing of large data sets.

On which platforms is it supported?

Currently, the library works with applications on WinForms, .NET Framework 4.7.2, ASP.NET Core, Mono Framework.

Artigos reenviados

06 de outubro de 2021

Como usar filtros e opções de ordenação (classificação) no FastCube VCL

A filtragem de dados é essencial ao trabalhar com informações. É difícil imaginar ferramentas analíticas sem tal opção. Na maioria das vezes, filtros e classificação são usados para: acessar dados rapidamente; tornar dados mais fáceis de usar; edição facilitada de dados; estruturação da informação. Você precisa usar a ferramenta Measure para trabalhar com filtros no FastCube VCL. Depois de clicar com o botão esquerdo do mouse, você verá a seguinte janela: Aqui você pode controlar os dados exibidos usando os botões na parte inferior.  - exibe todas measures (medidas);  - remove todas measures (medidas);  - inverte a ordem dos dados exibidos e não exibidos;  - move a measure (medida) um nível para cima;  - move a measure (medida) um nível abaixo;  - aplica alterações. As capturas de tela abaixo mostram como usar os botões para mover as colunas para cima e para baixo na lista funcionam. Também é possível aplicar a filtragem através do menu measures (medidas. Para fazer isso, clique com o botão direito do mouse no item que deseja filtrar e selecione “Filtrar este item” ou “Filtrar todos os outros itens”. O item que você precisa será filtrado. Agora vamos criar um filtro por condição. Clique com o botão direito do mouse em um dos itens da lista de campos e selecione “criar um filtro personalizado”. O filtro personalizado pode ser configurado no editor de intervalo. Pode incluir vários itens, como no exemplo abaixo. Você precisa clicar no botão do editor de medidas para filtrar os itens de agregação por indicador. Esta captura de tela mostra a janela “geral”, onde a filtragem será aplicada apenas para um item agregado. Neste caso, será o item “soma”. Agora você já conhece as opções de filtragem e classificação disponíveis no ambiente analítico FastCube VCL.
Ler
01 de outubro de 2021

How to use FastCube .NET in React application

UPD: Applies to the versions of FastCube .NET before 2022.1. License packages are now available on our NuGet server. The ReactJs library has become widespread in the web development of single-page applications. Previously we have covered how to display reports and the online report designer in React SPA application. Now it is possible to display cubes and slices of data from FastCube.Core on a web page. Let's consider how to do this. To create an ASP .NET Core app with a React frontend part, you can use a template in the .NET SDK. Run in the command line: dotnet new react -o MyReactApp This command will create a demo application that we can use to display the cube. Of course, for this, you must have the .NET Core SDK installed. In addition, the application will require Node.js. Go to the directory of the created application: cd MyReactApp and install javascript packages using the command: npm install Let's start working with the created web application. First, let’s install the FastCube packages. Open the Nuget package manager. In the upper right corner of the window, you will see a gear icon, which opens the settings of package sources. Click on it and add a new package source - a folder with our FastCube packages, which are located in the C:\Program Files (x86)\FastReports\FastCube.Net Professional\Nuget folder. Select the added package source in the drop-down list and install the packages: We connect FastCube in the Startup.cs file, add the code in the Configure () method: app.UseFastCube(); Our application already contains WeatherForecastController. Let's add our web method to it: [HttpGet("[action]")] public IActionResult ShowCube() { Cube cube = new Cube(); Slice slice = new Slice() { Cube = cube }; FilterManager filterManager = new FilterManager() { Cube = cube }; WebGrid grid; grid = new WebSliceGrid() { Slice = slice };   ViewBag.WebGrid = grid;   cube.SourceType = SourceType.File; cube.Load(Path.Combine("C:\\Users\\FR\\Downloads\\fastcube-net-master\\Demos\\Data\\", "Cubes", "calculated_measures.mdc")); return View(); } The Cube and Slice objects are related because, in fact, the slice is part of the cube. A WebGrid object is used to display an interactive crosstab. It can display both a WebCubeGrid slice and a WebSliceGrid cube. In our example, we loaded the cube that we previously created in the FastCube .NET desktop version. Pay attention to the class from which the controller inherits. It should be Controller, not BaseController. Now let's create a view for this method. This can be done by right-clicking on the ShowCube method signature. The view will contain a single line of the code: @await ViewBag.WebGrid.Render() Now let's move on to SPA application, which is located in the ClientApp folder. We need to add our component to the src->components folder. It will display the iframe with the view we created above. Add the Cube.js file with the following code: import React, { Component } from 'react'; export class Cube extends Component { static getCube() { return { __html: '<iframe width="1000" height="1000" src="weatherforecast/ShowCube" />' }; } render() { return ( < div dangerouslySetInnerHTML={Cube.getCube()} /> ); } } Everything is easy here. We display iframe that refers to a method in the controller. Now you need to add the component to the App.js application structure: import React, { Component } from 'react'; import { Route } from 'react-router'; import { Layout } from './components/Layout'; import { Home } from './components/Home'; import { FetchData } from './components/FetchData'; import { Counter } from './components/Counter'; import { Cube } from './components/Cube';   import './custom.css'   export default class App extends Component { static displayName = App.name;   render () { return ( <Layout> <Route exact path='/' component={Home} /> <Route path='/counter' component={Counter} /> <Route path='/fetch-data' component={FetchData} /> <Route path='/cube' component={Cube} /> </Layout> ); } } In addition, you need to add a new menu item in the NavMenu.js file: import React, { Component } from 'react'; import { Collapse, Container, Navbar, NavbarBrand, NavbarToggler, NavItem, NavLink } from 'reactstrap'; import { Link } from 'react-router-dom'; import './NavMenu.css';   export class NavMenu extends Component { static displayName = NavMenu.name;   constructor (props) { super(props);   this.toggleNavbar = this.toggleNavbar.bind(this); this.state = { collapsed: true }; }   toggleNavbar () { this.setState({ collapsed: !this.state.collapsed }); }   render () { return ( <header> <Navbar className="navbar-expand-sm navbar-toggleable-sm ng-white border-bottom box-shadow mb-3" light> <Container> <NavbarBrand tag={Link} to="/">FastCubeReact</NavbarBrand> <NavbarToggler onClick={this.toggleNavbar} className="mr-2" /> <Collapse className="d-sm-inline-flex flex-sm-row-reverse" isOpen={!this.state.collapsed} navbar> <ul className="navbar-nav flex-grow"> <NavItem> <NavLink tag={Link} className="text-dark" to="/">Home</NavLink> </NavItem> <NavItem> <NavLink tag={Link} className="text-dark" to="/counter">Counter</NavLink> </NavItem> <NavItem> <NavLink tag={Link} className="text-dark" to="/fetch-data">Fetch data</NavLink> </NavItem> <NavItem> <NavLink tag={Link} className="text-dark" to="/cube">Cube</NavLink> </NavItem> </ul> </Collapse> </Container> </Navbar> </header> ); } }   The application is ready. Let's run it: Thus, you can display your web cube using FastCube.NET in a React SPA application.
Ler
Fast Reports
  • 800-985-8986 (English, US)
  • +31 97 01025-8466 (English, EU)
  • +49 30 56837-3928 (German, DE)
  • +55 19 98147-8148 (Portuguese, BR)
  • info@fast-report.com
  • 66 Canal Center Plaza, Ste 505, Alexandria, VA 22314

© 1998-2025 Fast Reports Inc.