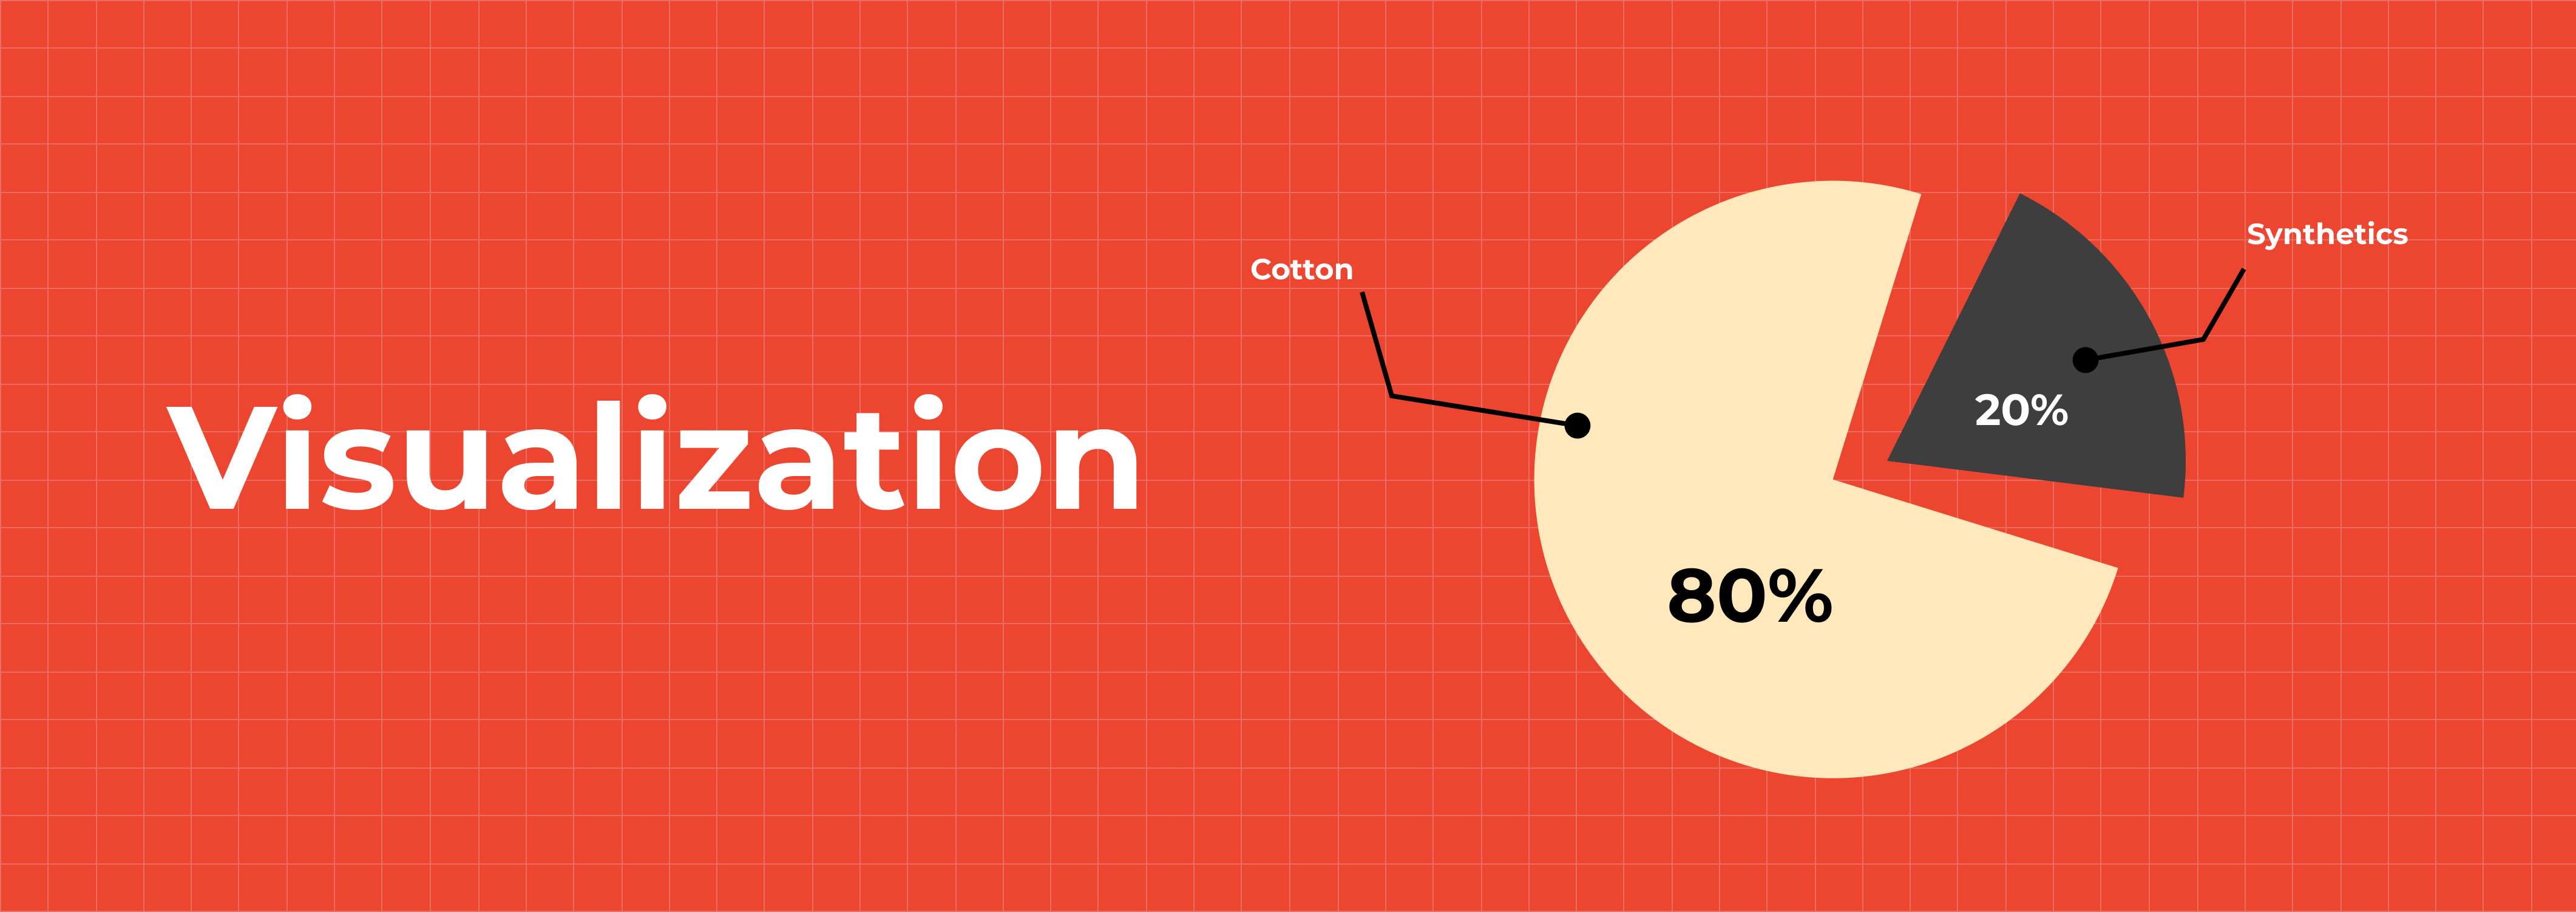
Visualisierung
Reliable support in decision making by presenting even the most complicated information in an easily readable form.
Visual dashboards help to estimate the status of processes and systems at a glance, instantly provide insight into the existing trends and tendencies.
FastReport Business Graphics allows using different color palettes to shade different levels of data presentation. Make information perception easier by adding hatch to parts of the charts or creating recognizable gradients.
The freedom of choosing color solutions enables to create charts for thematic applications or customize the existing palettes by setting customer values.
Choose a variant of shading: solid color, gradient, or hatch. The available options include changing the font, border around the text, width and color of the chart border.


