How to create an invoice from a Delphi application
As for Delphi applications, we understand that we are talking about applications implemented in VCL (Visual Component Library) for the Windows operating system. The popularity of Delphi VCL slightly faded with the advent of the C and .Net platform but there are lots of Delphi developers all around the world. Many applications are written in VCL and need to be modernized.
If you are implementing an accounting information system for goods turnover, you will need to generate some documents from the application. This can be reports, sales and cashier’s checks, invoices. In this article we will look at the whole process of printing an invoice from creating an application to report displaying.
We will use the Delphi 7 development environment to create the application, and the FastReport VCL report generator to create the report.
The work on the application comes down to adding the necessary components to the form and setting them up.
Find the FastReport tab on the component panel and add frxReport component to the form. We also need to create a data source for the report. As an example, we will use the demo.mdb database from the FastReport VCL distribution. Use the following tables: Orders, Customers, Items, Parts.
Drag and drop the ADOConnection component onto the form from the ADO tab in the component palette. Then add four ADOTable components.
From the DataAccess tab, add four DataSource components.
From the FastReport tab, add four frxDBDataSet components.
Now we got: ADOTable, DataSource, frxDBDataSet and you need to configure them as three.
Let’s do it.
First three:
- For ADOTable, set the properties:
− Connection – ADOConnection1;
− Name – Orders;
− TableName – orders.
- For DataSource, set the properties:
− DataSet – Orders.
- For frxDBDataSet, set the properties:
− DataSet – Orders;
− UserName – Orders.
Second three:
- For ADOTable, set the properties:
− Connection – ADOConnection1;
− Name – Customer;
− IndexFieldnames – CustNo;
− MasterSource – DataSource1;
− MasterFields - CustNo
− TableName – customer.
- For DataSource, set the properties:
− DataSet – Customer.
- For frxDBDataSet, set the properties:
− DataSet – Customer;
− UserName – Customer.
Third three:
- For ADOTable, set the properties:
− Connection – ADOConnection1;
− Name – Items;
− IndexFieldnames – OrderNo;
− MasterSource – DataSource1;
− MasterFields - OrderNo
− TableName – items.
- For DataSource, set the properties:
− DataSet – Items.
- For frxDBDataSet, set the properties:
− DataSet – items;
− UserName – Items.
Fourth three:
- For ADOTable, set the properties:
− Connection – ADOConnection1;
− Name – Parts;
− TableName – parts.
- For DataSource, set the properties:
− DataSet – Parts.
- For frxDBDataSet, set the properties:
− DataSet – Parts;
− UserName – Parts.
You probably noticed that the Customer and Items tables have a relationship with DataSource1 (the first table – Orders). This means that they are linked by key (one-to-many relationship). Many orders can have only one Customer, etc. This is necessary so that when displaying information on a specific order in the report, the data will be pulled up from the linked tables relevant for this order.
Let’s create computable fields in ADOTable for the Items table to simplify our further work with the report template. Double click on this object and see a window with table fields. Rather it is initially empty, but you can load them from the context menu by selecting Add fields …:
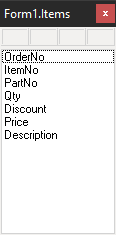
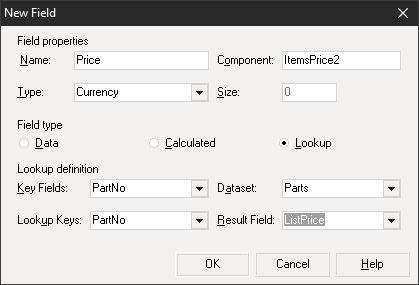
The Price and Description fields will be taken from the Parts table.
Select New field… in the context menu and add the Price field:
Add a product description (Description field) the same way:
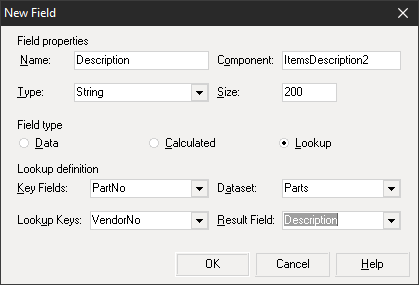
Thus, we eliminated the need to use the Parts table in our report; we’d already gotten everything we needed from it.
Now, as soon as we’ve created the data source and configured the relationships between the tables, let’s add a couple of buttons to the form: Design Report and ShowReport.
As you’ve probably guessed, the first button launches the report designer and the second one displays the report.
Add a click event for each of the buttons. Here is the event handler code to display the report designer:
1 |
frxReport1.DesignReport();
|
To print the finished report, you can add the Open File dialog box to the form to select the report created in the designer. The code for printing the report will be like this:
1 2 3 4 5 6 7 8 |
OpenDialog1.Filter := 'FastReport VCL (*.fr3)|*.FR3'; OpenDialog1.Execute(); if Length(OpenDialog1.FileName)>0 then begin frxReport1.LoadFromFile(OpenDialog1.FileName); frxReport1.PrepareReport(); frxReport1.Print(); end |
If you need to preview the report, you can replace the Print function with the Report display:
1 |
frxReport1.ShowReport();
|
Now you can run the application, click on the Design report button and proceed to the report creation.
It’s time to talk about the report we are going to create. To make the document easy to understand and avoid questions from the customer, you need to fill it with all the necessary information. But at the same time you should not overload your document with it. Let’s try to maintain this delicate balance. So, in our opinion, the invoice should contain the following information:
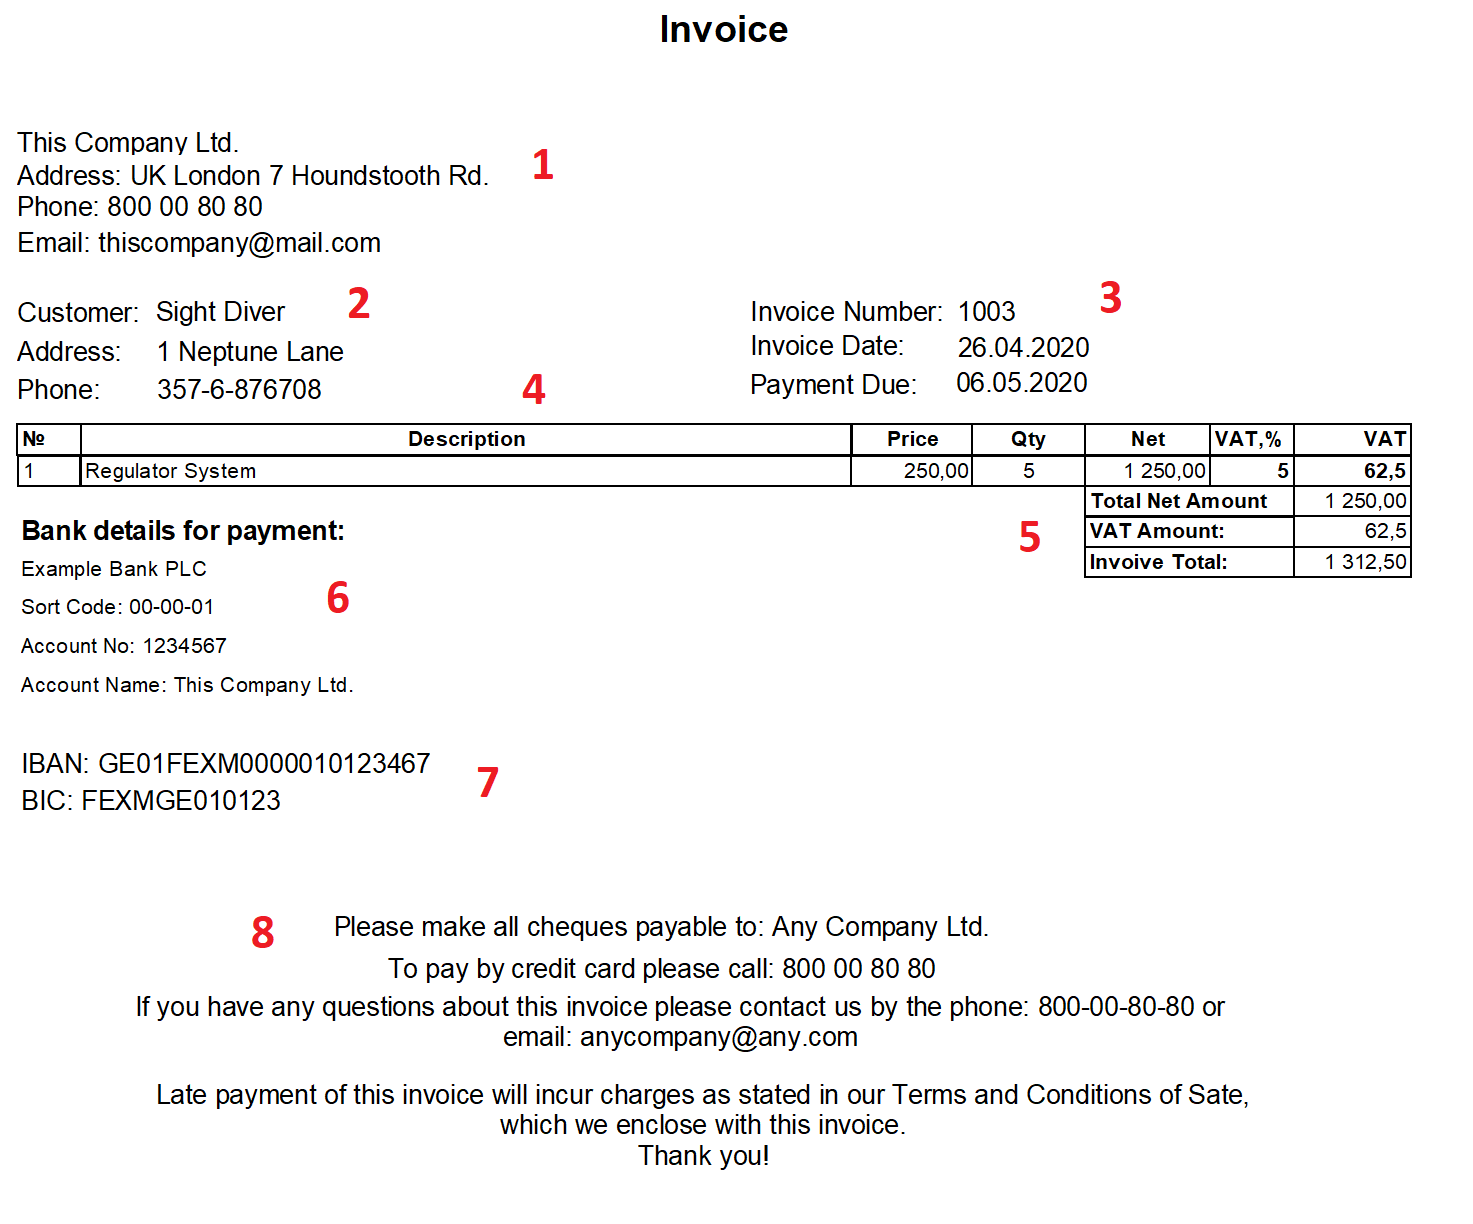
This figure highlights important areas of the document.
- Information about the seller. Any official document should contain information about the seller: name, address, phone, email, additional information (optional);
- Information about the contact person of the buyer – it is necessary to indicate the person actually responsible for the payment;
- Order and invoice identifiers, invoice issuing and due dates. These identifiers will help to find an invoice or order in the database, in case a customer has any questions later;
- Information about the order content. Your customer must understand what he pays for. It is necessary to specify the name and quantity of the goods, as well as the cost per unit;
- The total amount. Total amounts are necessary not only for making a payment but also for understanding the calculation;
- Payment details. Since this is a payment invoice, if should contain the payee details;
- Bank details for abroad payments. Even if, in this case, the customer is not from abroad, you can leave this data for a unified form;
- Explanatory information. It is important to provide contact details in case of questions. You should also warn about the consequences of late payment. This will engage the customer to not delay it.
We are going to create such a document in the report designer, which we’ve already launched. First of all, select report datasets.
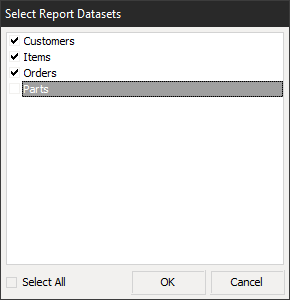
We do not need the Parts table in this report so there is no need to select it. Let’s move on to creating the template. There are two data bands in our report: MasterData and DetailData. In the first data band, we output the information about the client:
- name - Customer.Company;
- address - Customer.Addr1;
- phone - Customer.Phone.
…and the customer:
- invoice number – Orders.OrderNo;
- invoice date – system variable [Date];
- payment due – current date [Date] + number of days.
This band is linked to the Orders table. The content information of the order will be displayed in a subordinate Data band: product name, quantity, item price, price for specified quantity, VAT which is not included in the price in some countries (shown as an example), total VAT amount.
VAT amount, Net amount, invoice total will be displayed in the footer. Payment details will also be shown there.
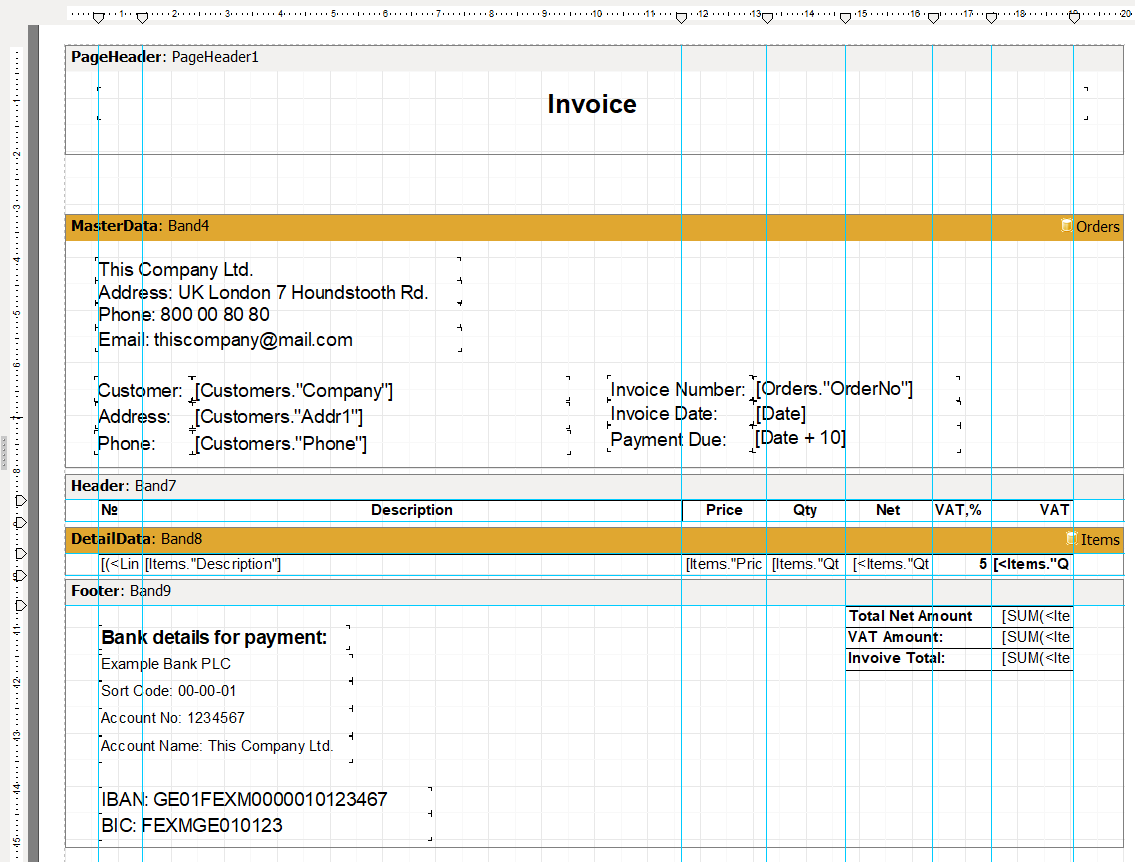
Add some explanatory information to the page footer to avoid some questions from the customers:

Net subtotals are calculated within a single table record by multiplying the items quantity by item price:
[<Items."Qty">*<Items."Price">]
The VAT amount is calculated by the formula:
Items quantity * items price * VAT %
[<Items."Qty">*<Items."Price">*0.05]
The total Net amount:
∑(items quantity * item price)
[SUM(<Items."Qty">*<Items."Price">)]
The total VAT amount:
∑( items quantity * item price * vat rate)
[SUM(<Items."Qty">*<Items."Price">)*0.05]
The invoice total:
∑(items quantity * item price)+ ∑( items quantity * item price * vat rate)
[SUM(<Items."Qty">*<Items."Price">) + SUM(<Items."Qty">*<Items."Price">)*0.05]
That’s it. Save the report in the local storage and close the report designer. Using the second button, select the generated report and get the Print dialog box or preview window, if you used ShowReport() in the button code.
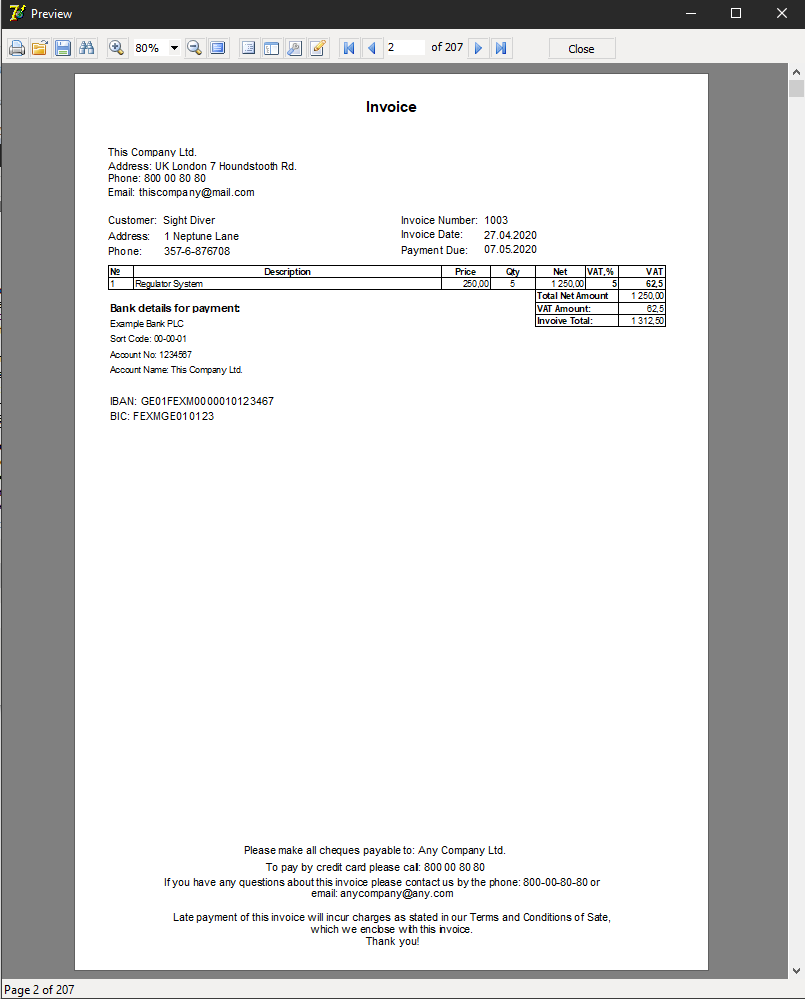
Thus, we created a payment invoice and displayed it to the user just in half an hour. Now, from the report preview window, we can send it to print or export it to one of the popular electronic document formats: PDF, DOCX, XLSX, RTF and many others.