What is FastReport .NET WEB report generator?
FastReport .NET WEB is a universal set of components for working with reports on various platforms and operating systems. Develop your documents directly in your browser without installing additional software on your computer. The set includes all the necessary reporting tools for easy integration with your project based on ASP.NET, ASP.NET MVC, .NET Core, Angular, React, Vue, Blazor Server, and Blazor WASM.
Features and Benefits WEB

Blazor Server
When using Blazor Server technology, all application logic works on the server side, and only the user interface of the viewer and the report designer is displayed in the browser window. When interacting with the interface, the browser sends an event, the server processes it and sends back updated information.
All work with the visual part of the components, data processing, and report generation takes place on the server side, which allows you to use reporting components on almost any device. Server performance is crucial here.
")
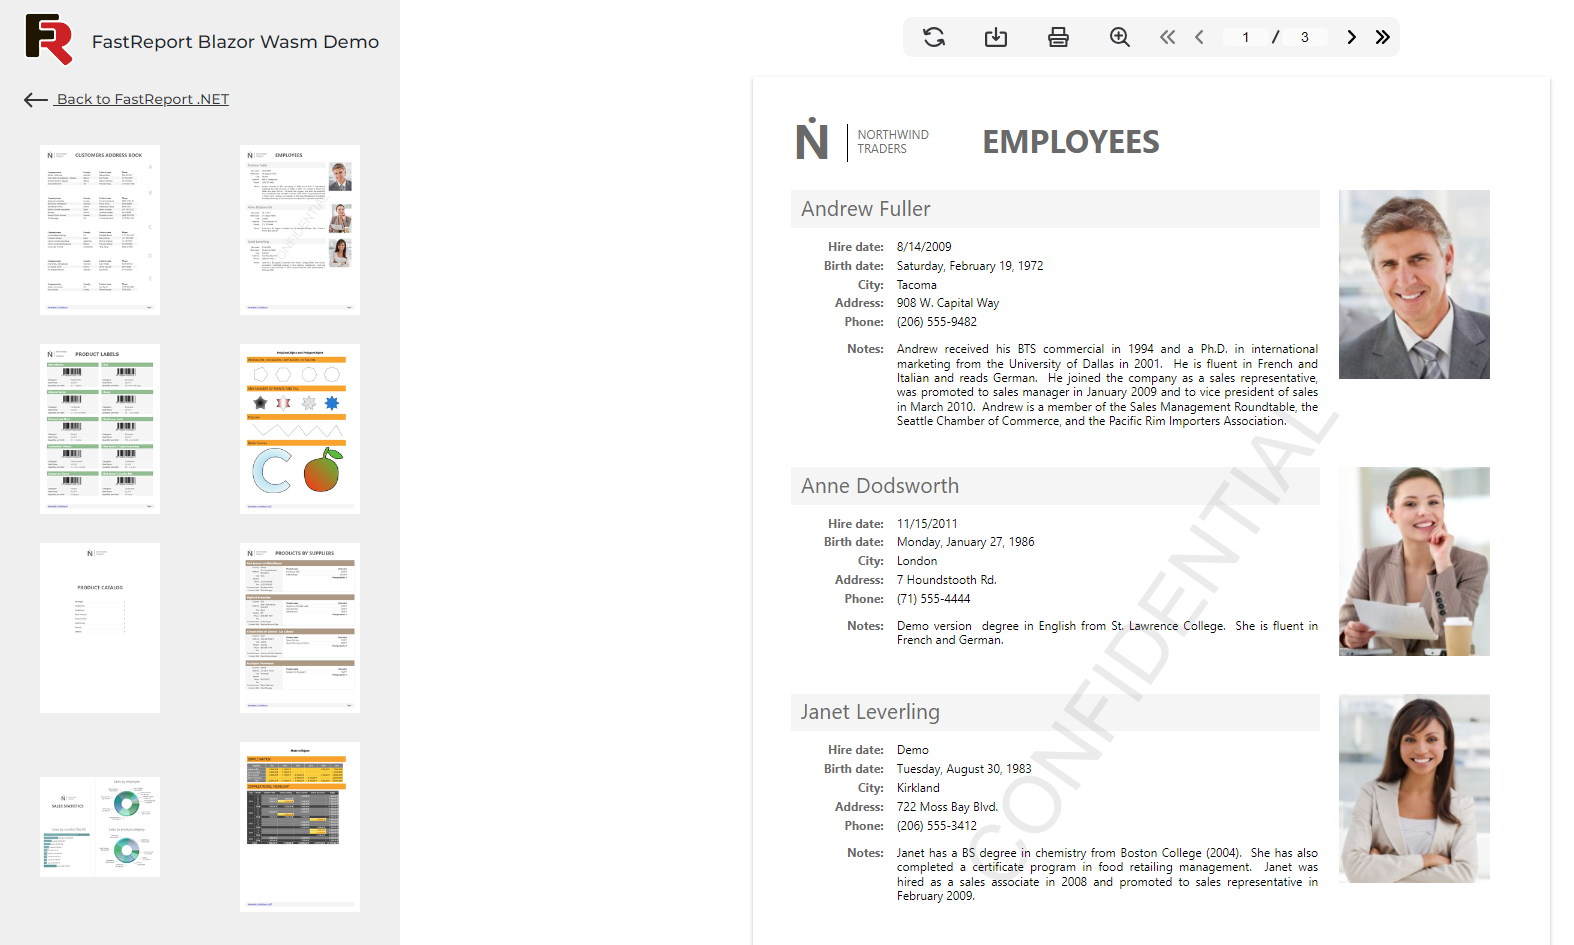
Blazor WebAssembly (WASM)
Develop applications right in the browser. The visual part and event handling are configured using C# code and Razor. The application is compiled into .NET assemblies and loaded entirely into the browser using the Web Assembly.
When the report generator is running, browser resources are used, which means that the server requirements are minimal. Web Assembly is suitable for those who need to save server resources and security is not so important.
The files are saved on the client side with access to the report template. At the same time, passwords will be delivered openly, which is why we recommend creating a REST service for presenting data, and in this case using our set of WEB components as a showcase.

ASP.NET components
As technologies are evolving rapidly, our web components are designed with the needs of many developers in mind. We follow best web practices to ensure that our components can be easily integrated with server-side web APIs.
You can change or replace your server-side API implementation at any time, and then easily configure our components in Angular, React, and Vue.
Report Designer right in the browser
The FastReport online report designer allows users to create, edit, and view reports from devices on the Android, iOS, or Windows platforms. The designer can be launched on any device with a modern browser, be it a computer, tablet, smartphone, game console, or TV. Full-featured operation in the browser is possible thanks to the touch-oriented design of the designer. The online designer has a familiar business user interface of an office application with full support for hotkeys. The designer does not use Flash or Java technologies, reducing loading and saving time.

Data processing
The set of WEB components works with ADO.NET data sources. It supports data sorting and filtering, master-detail relationships. Everything can be configured with just a few mouse clicks. It is possible to connect to ADO, MS SQL, and XML databases. Connectors are available for connecting to other types of databases, and there is also the ability to retrieve data from business objects of the IEnumerable type.
Your report can contain data (tables, queries, database connections). Thus, you can not only use the data available in your application but also connect to any databases directly from the report. You can use the full power of .NET in your report for complex data processing, management of dialog forms, and much more.
The report can contain dialog forms to request parameters before generating the report. Dialog controls support the ability to connect to data and subsequently filter it. Filtering can be added to any report, and it does not require writing any code. Using the visual query builder, you don't need to know SQL to build a complex query from multiple tables.

Preview and print
The pre-prepared report can be examined in detail in the Report Viewer's preview window. Our component supports working with parameters, multi-level detailing, and interactive reports. You can define a response to a mouse click on an object in the preview window. For example, you can build and display another report that shows detailed information about the object the user clicked on.
Additional print settings. The following options are available to you: cutting large report pages into smaller ones, printing multiple small pages on one large page, or printing on a specific format with scaling. Do you need to print a report containing A3-sized pages on a regular A4 printer? Now it's not a problem!

Exports to convenient formats
Filters for exporting the finished report to multiple formats: PDF, RTF, XLSX, XML, DOCX, TXT, CSV, PowerPoint, HTML, MHT, XPS, JPEG, BMP, PNG, Open Document Format (ODT, ODS, ODP), XAML, Scalable Vector Graphics (SVG), DBF, PPML, etc. Cloud support: OneDrive, Google Drive, Box, Dropbox, FastReport Cloud.
The WEB components allow you to quickly convert reports with editable fields (such as text fields, combo boxes, checkboxes, radio buttons, and graphic fields) into PDF documents without connecting additional libraries. Save your reports in popular formats: PDF 1.5, PDF/A-1a, PDF/A-2a, PDF/A-2b, PDF/A-2u, PDF/A-3a, PDF/A-3b, PDF/X-3, and PDF/X-4, which are secure, accessible, and reliable.

Ultimate .NET
This set of components is part of the Ultimate solution, with which you can create your business projects on all modern .NET, ASP.NET, Blazor, WASM, WPF, WinForms, Avalonia UI, Mono, and other platforms. With your team, you can work both in the desktop designer and directly from the browser. The Ultimate package also includes components for data visualization, namely business graphics with a set of charts and OLAP products for fast processing of large data sets.
Delivery options
| Features |
from $1,499
|
from $799
|
from $499
|
|---|---|---|---|
| FastReport Engine |
|
|
|
| WEB components |
|
|
|
| WinForms components |
|
|
|
| Avalonia components |
|
|
|
| WPF components |
|
|
|
| Mono components |
|
|
|
| Online Designer |
|
|
|
| FastReport.Drawing (Skia) |
|
|
|
| System.Drawing (GDI) |
|
|
|
| Report script engine |
|
|
|
| Data connections |
|
|
|
| Reporting features |
|
|
|
| Report objects |
|
|
|
| Barcodes |
|
|
|
| Charts |
|
|
|
| Printing |
|
|
|
| Export in formats |
|
|
|
| Transports |
|
|
|
| Plugins |
|
|
|
| Custom plugin support |
|
|
|
| Support |
|
|
|
| Source Code |
|
|
|