How to display band grouping results in FastReport VCL
One of the new features appeared in FastReport VCL 6 is the ability to display the grouping results in the header bands. Previously, you could only display the results after grouping. If the group is large enough, you have to scroll it down to find out the result. It is much more convenient to print the result in the group header.
Let's look at the peculiarities of using the totals in the header bands. At the beginning a little theory about how it works.
The totals in the headers are implemented using deferred processing. During report output, all objects that have non-standard processing conditions are placed in a special list. Then, upon reaching a certain condition, the processing of the object is triggered.
There is a number of conditions that must be observed for the successful display of the total in the header band:
- The header band must have a paired footer band. This is necessary to determine the structure of the report. Or better saying, to determine the events that we will consider below;
- A paired footer band must have a field that calculates the total. The same field will be added to the header band. If you do not need the result in the footer of the group - just make it invisible.
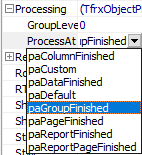
Now consider the new property of the "Text" object. The Processing property allows you to define an event by which a value will be displayed in this object. In fact, Processing includes 2 properties - GroupLevel and ProcessAt. GroupLevel allows you to set the nesting level of the groups. This is done in case you use several nested groupings. Thus, you can display your totals in each heading in each group.
ProcessAt contains a list of events by which you can start processing the field. Here are the possible values:
- paColumnFinished - at the end of the column display;
- paCustom - an arbitrary event created by the user in the report script;
- paDataFinished - after displaying all data;
- paDefault - the default value;
- paGroupFinished - at the end of the group display;
- paPageFinished - when the page is displayed;
- paReportFinished - when the report is displayed;
- paReportPageFinished - when the report template page is displayed.
For example, you have chosen to generate a total when the group ends. To find out that the group has closed, the FR requires a group cellar. If the selected event is paReportFinished, the band page footer is required.
Now let’s consider all of the above in practice. We need to create a report with two sessions. One is embedded in another. Take the Sales table from the demo database. 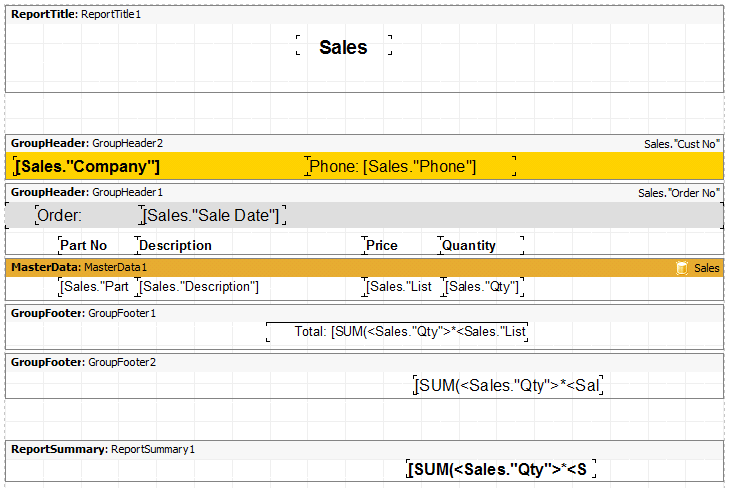
As you can see from the template, we created a group with the company name. Then we added the group with the order number. And, finally, in the band "Data" the information from the order was displayed. Each group has the footer with the total of:
[SUM (<Sales. "Qty"> * <Sales. "List Price">, MasterData1)].
The summary is displayed in the report summary band.
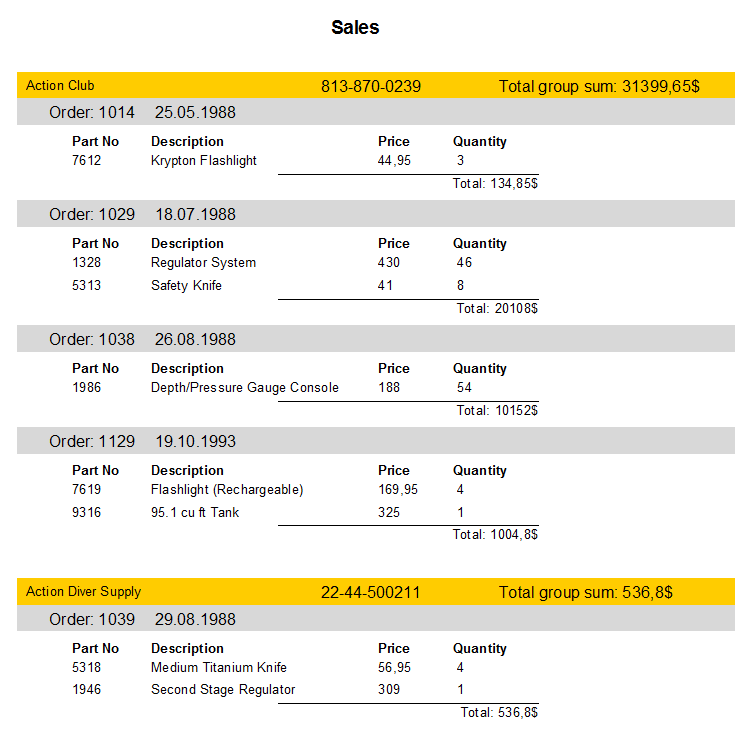
Our goal is to bring the results in the header band. Let's start with the first group. Add the text field to the right: "Total group sum: [SUM (<Sales." Qty "> * <Sales." List Price ">, MasterData1)] $". In the properties of this text box, we find Processing and set the value of paGroupFinished:
Run the report:
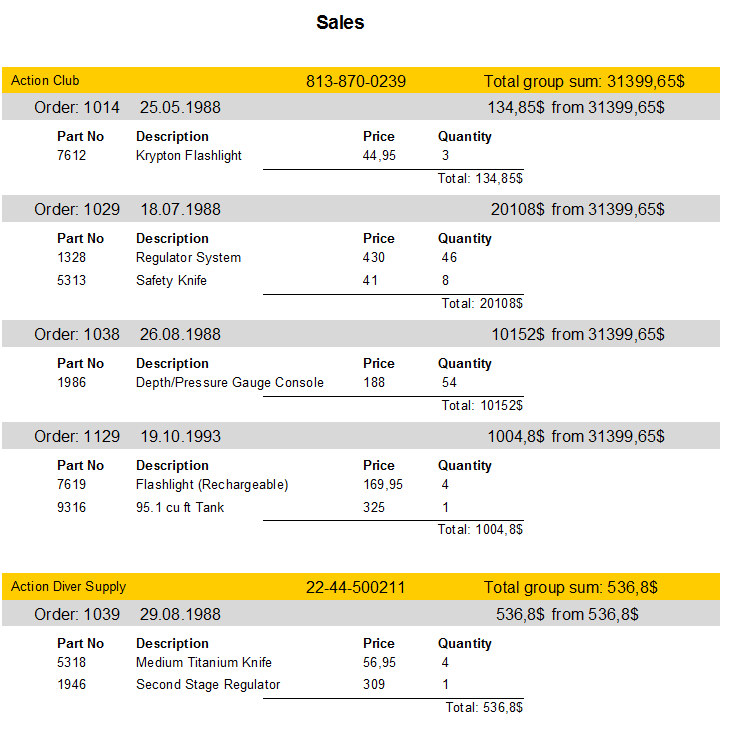
Now let’s add two text fields to the second group. We will place them one after another on the right. For the first group, the value is "[SUM (<Sales." Qty "> * <Sales." List Price ">, MasterData1)] $". For the second one - "from [SUM (<Sales." Qty "> * <Sales." List Price ">, MasterData1)] $".
Now for the first group we set the properties: GroupLevel - 0, ProcessAt - paGroupFinished.
For the second one we set the same properties: GroupLevel - 1, ProcessAt - paGroupFinished.
Thus, you will first deduce the result for the current group, and then for the group above the level. Let's see how it looks like:
It remains to display the grand total for the entire report. Add a text field to the header of the report: Total sum: [SUM (<Sales. "Qty"> * <Sales. "List Price">, MasterData1)] $. We set the properties for it: GroupLevel - 0, ProcessAt - paReportPageFinished. Run the report:
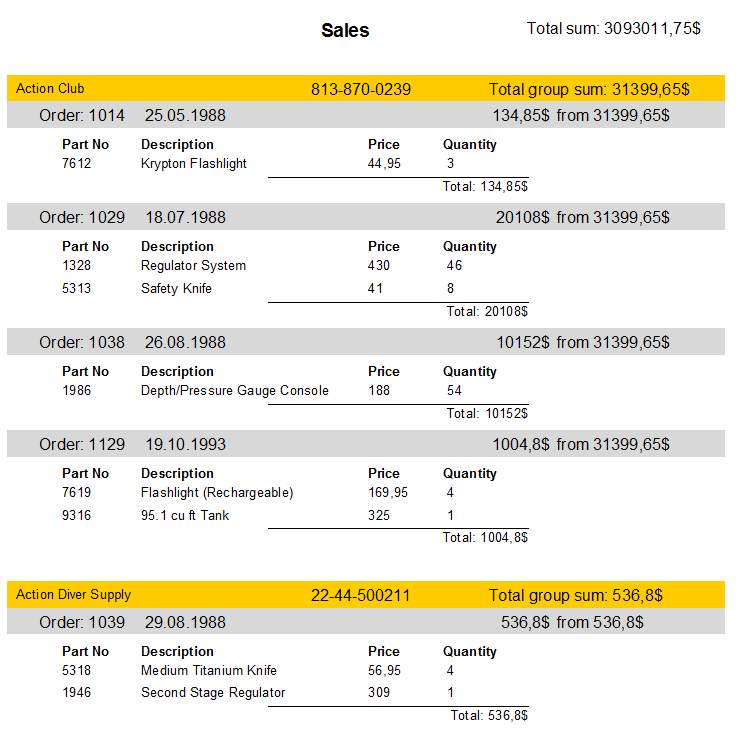
In each case, we display a field with the same aggregate expression, but we get different values for the groups and the report header. It's all about the time of formation the total. At some time point, the aggregate function has different values. That's why it's important to set the ProcessAt parameter correctly.