Working with graphs and charts in FastReport VCL
We continue to publish support articles for students as part of the Academy's educational programme. Every developer at some point will need to work with business graphics: diagrams, charts, barcodes. And our FastReport VCL will help them do it!
Creation of charts and graphs
To draw a diagram the TfrxChartObject component is used. In Rad and Delphi it is based on the TeeChart library for Delphi/Rad, which comes with Delphi/Rad. Alternatively the TeeChartPro library can be used, but is purchased separately. In Lazarus the diagram component is based on the TAChartLazarusPkg package, which is the LGPL licensed TeeChart component and is available from the standard Lazarus package manager.
Let's look at a simple chart with the country table as an example. It contains data about countries, their area and population:
Name Area Population
Algeria 2 381 740 36 485 828
Angola 1 246 700 20 162 517
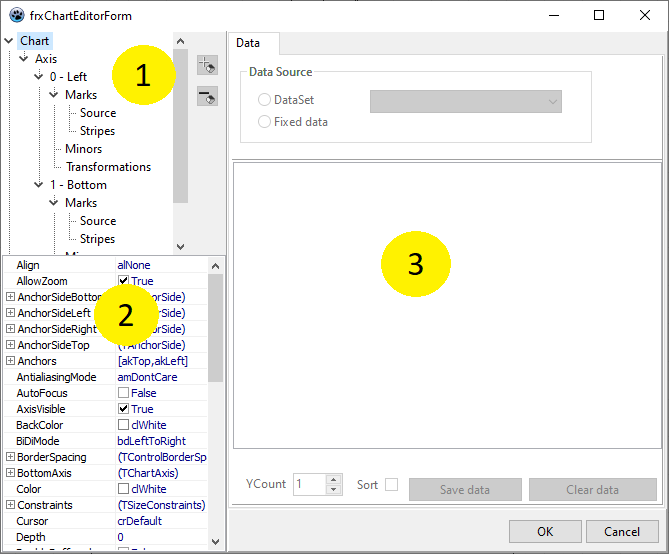
Add a "Diagram" object to the report sheet and set the size of the object to 18x8cm. To customise the object, call its editor by double-clicking.
The numbers in the figure indicate:
1 - Diagram structure. It can contain one or more series.
2 - Object Inspector, which displays the properties of the element selected in window 1. This way you can fine-tune the properties of the diagram.
3 - series data binding panel, which becomes active when a series is selected in window 1.
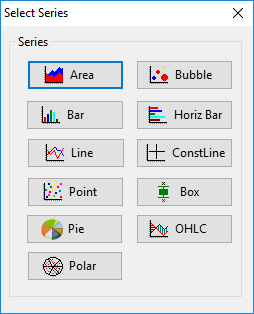
The first time we run the editor window, it will look like the following figure. But first we need to add one or more series (one in our example). In the tree marked with number 1, we click on Series and then on the button , then select the type of chart and type from the pop-up window. Now we will use a pie chart ("Pie").
After adding the series in area 3, the Chart Settings window becomes active. Here you must specify which data will be used in the diagram. First select the data set from the "Data set" drop-down list. The fields "Y" and "Text" will be filled in as follows - they can also be selected from the drop-down lists:
In this pie chart example, the "Text" values are used to display explanatory text, and only the "Y" values are used to build the chart. Optionally, you can select values for "Color", which allows you to set the desired colour for each "slice" of the diagram. Don't forget to save our data!
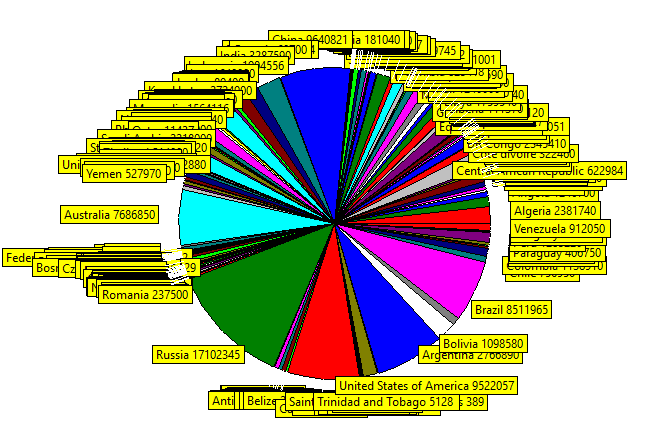
Enable captions for the chunks, set Marks -> Style to "smsLabelValue" (display label and value), turn off the axes visibility, setting both axes ("0 - Left" and "1 - Bottom") Visible to False. Press OK to close the editor and run the report for plotting:
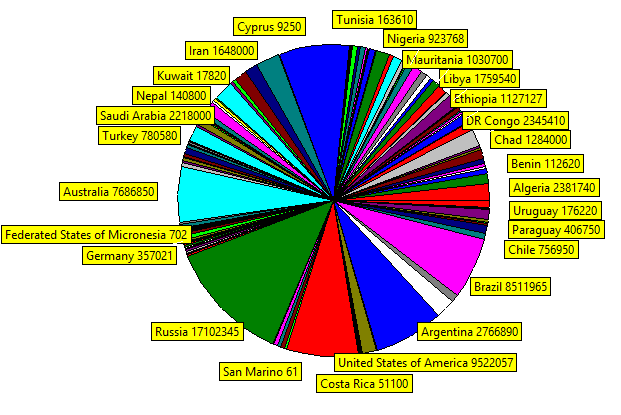
This is a good start, but the diagram clearly needs some work. Let's turn on one more property that will separate the labels from each other before moving on to the next point. To do this let's set PieSeries -> Marks -> OverlapPolice from opIgnore to opHideNeighbour.
Visually it looks better already!
Some helpful settings
Let's look at some settings that can be useful for changing the appearance of a diagram. These can only be done in the diagram object inspector:
- Axis - settings for the axes of the diagram.
- Legend - settings of appearance of explanatory table (legend).It is present both for the Chart and for each series separately. But at the moment of writing this article the legend can be created only statically or using a script. We are still working on its auto-generation.
- Marks - setting the appearance of the legend.
- Title - customisation of the caption above the diagram.
Diagram with fixed data
In the previous example we built a diagram based on data from a database table, but you can also enter data into the diagram manually. This method is useful for creating small diagrams.
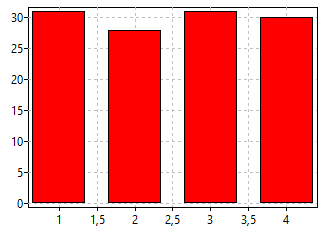
Let us demonstrate this with a small example. Add a diagram to the report page and enter its editor. Insert a series of 'Bar' and go into the property settings:
It is worth mentioning that we will have to manually enter values for the X-axis. When you run the report, you will see the following result:
Barcode creation
FastReport has the useful element of barcode. This greatly extends the scope of our report generator.
To add a barcode to the report you need to select the object rom the side toolbar. Immediately afterwards the settings window appears:
The Preferences window allows you to specify the code itself, select the barcode type, enable checksum verification option and display the code symbols. The object can be rotated 0°, 90°, 180°, 270° degrees for easy placement.
The code for the barcode can be set by a field from the database, a function, a variable, or entered manually. The following figure shows the expression editor.
Don't be surprised if the code in the barcode does not change after selecting a value. Be sure to save the whole thing and then run the report afterwards. From there, it is clearly visible that the entered code is displayed and has formed a barcode.
On behalf of the entire company we wish all the students every success in their studies!
