How to remove object intersection in FastReport VCL
In the new version of FastReport VCL 2022.2, we have added new functions to the report designer that will help you detect the most common errors when developing report templates as well as fix them.
FastReport VCL is a report generator with a free layout of objects. This means that objects can be arranged in any order, including overlapping other objects. These objects can be successfully converted to free object layout export formats but can cause problems in documents with a rigid structure. An example of such a format would be an XLSX table. Intersected objects cannot be exported due to the format's strict tabular structure. You can learn more about the correct design of a report in the user guide.
In this article, we will look at how to identify such problems in the finished report, and what tools can be used to quickly fix them.
Problem. Finding object intersections
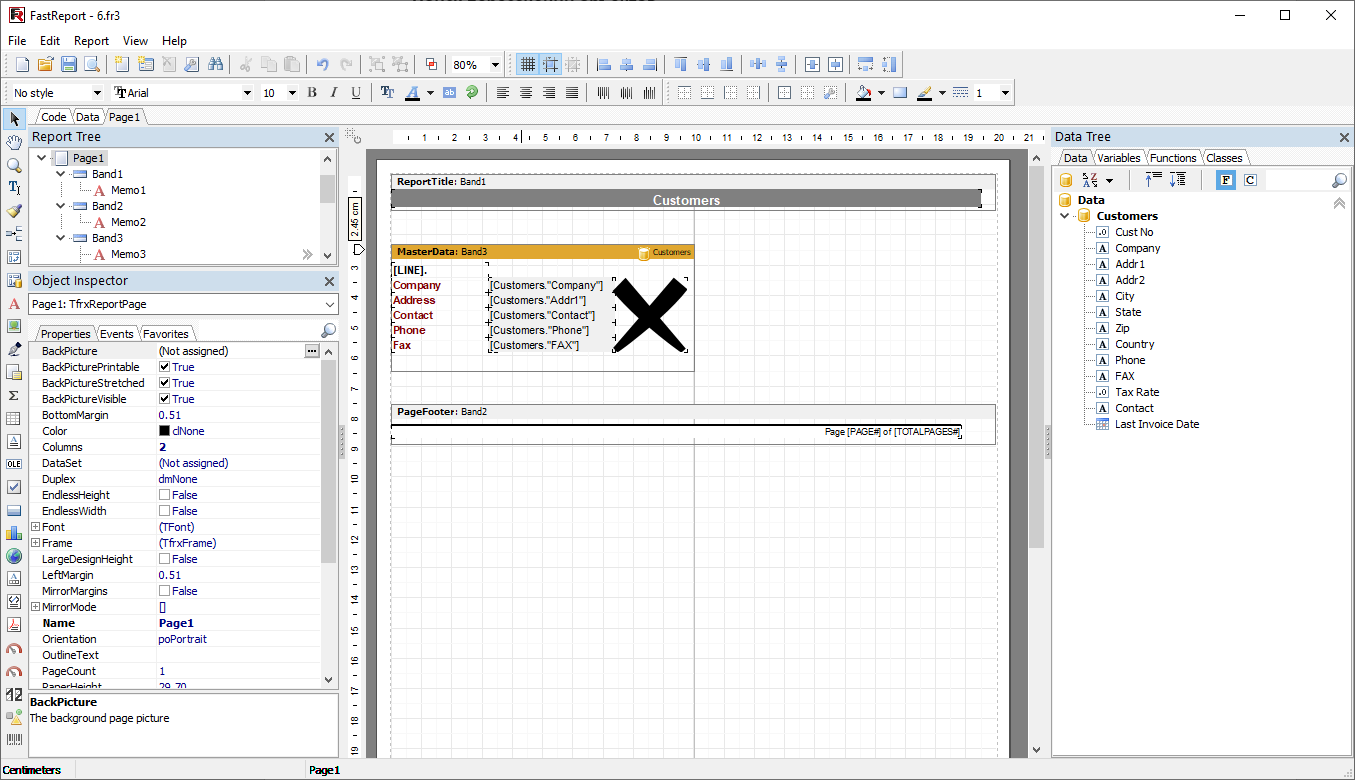
First, you need to open the report in the report designer. The example uses a modified report from the main demo application.
At first glance, there are no problems. Let's see how the rendered report looks like in the preview.
Problems can become apparent with tabular exports such as XLSX.
We see that extra columns appeared in the table during export and the contents of the object were cut off. It is difficult to detect such errors even in a report that has been running for a long time.
Let's return to the report designer. Starting from FastReport VCL 2022.2, there is now a button on the standard toolbar in the report designer enabling a new feature - "Highlighting the intersection".
Press the button to highlight the intersection of objects.
Now we can see which objects overlap and where they intersect.
Solution
It is quite simple to fix errors in a demo report because the intersections are clearly visible, and there are not so many report objects. Let's just move the problem objects.
How to speed up fixing a report with many objects?
In this case, another feature from the release of FastReport VCL 2022.2, Auto Guides, can help the report developer. In this mode, extension lines are automatically generated for all four points of each object in the report. Importantly, this mode does not replace extension lines added by the user on the report page but supplements them.
You can change this mode with the help of the button on the upper line of the workspace of the report designer.
There are 4 modes in total:
Automatic leader lines disabled –user-added extension lines are used. The button icon in this mode looks like ![]() .
.
Automatic leader lines enabled –extension lines are created automatically for each object. The button icon in this mode looks like ![]() .
.
Only horizontal automatic leader lines are enabled - extension lines are created automatically for each object only in the horizontal plane. The button icon in this mode looks like ![]() .
.
Only vertical automatic leader lines are enabled - extension lines are created automatically for each object only in the vertical plane. The button icon in this mode looks like ![]() .
.
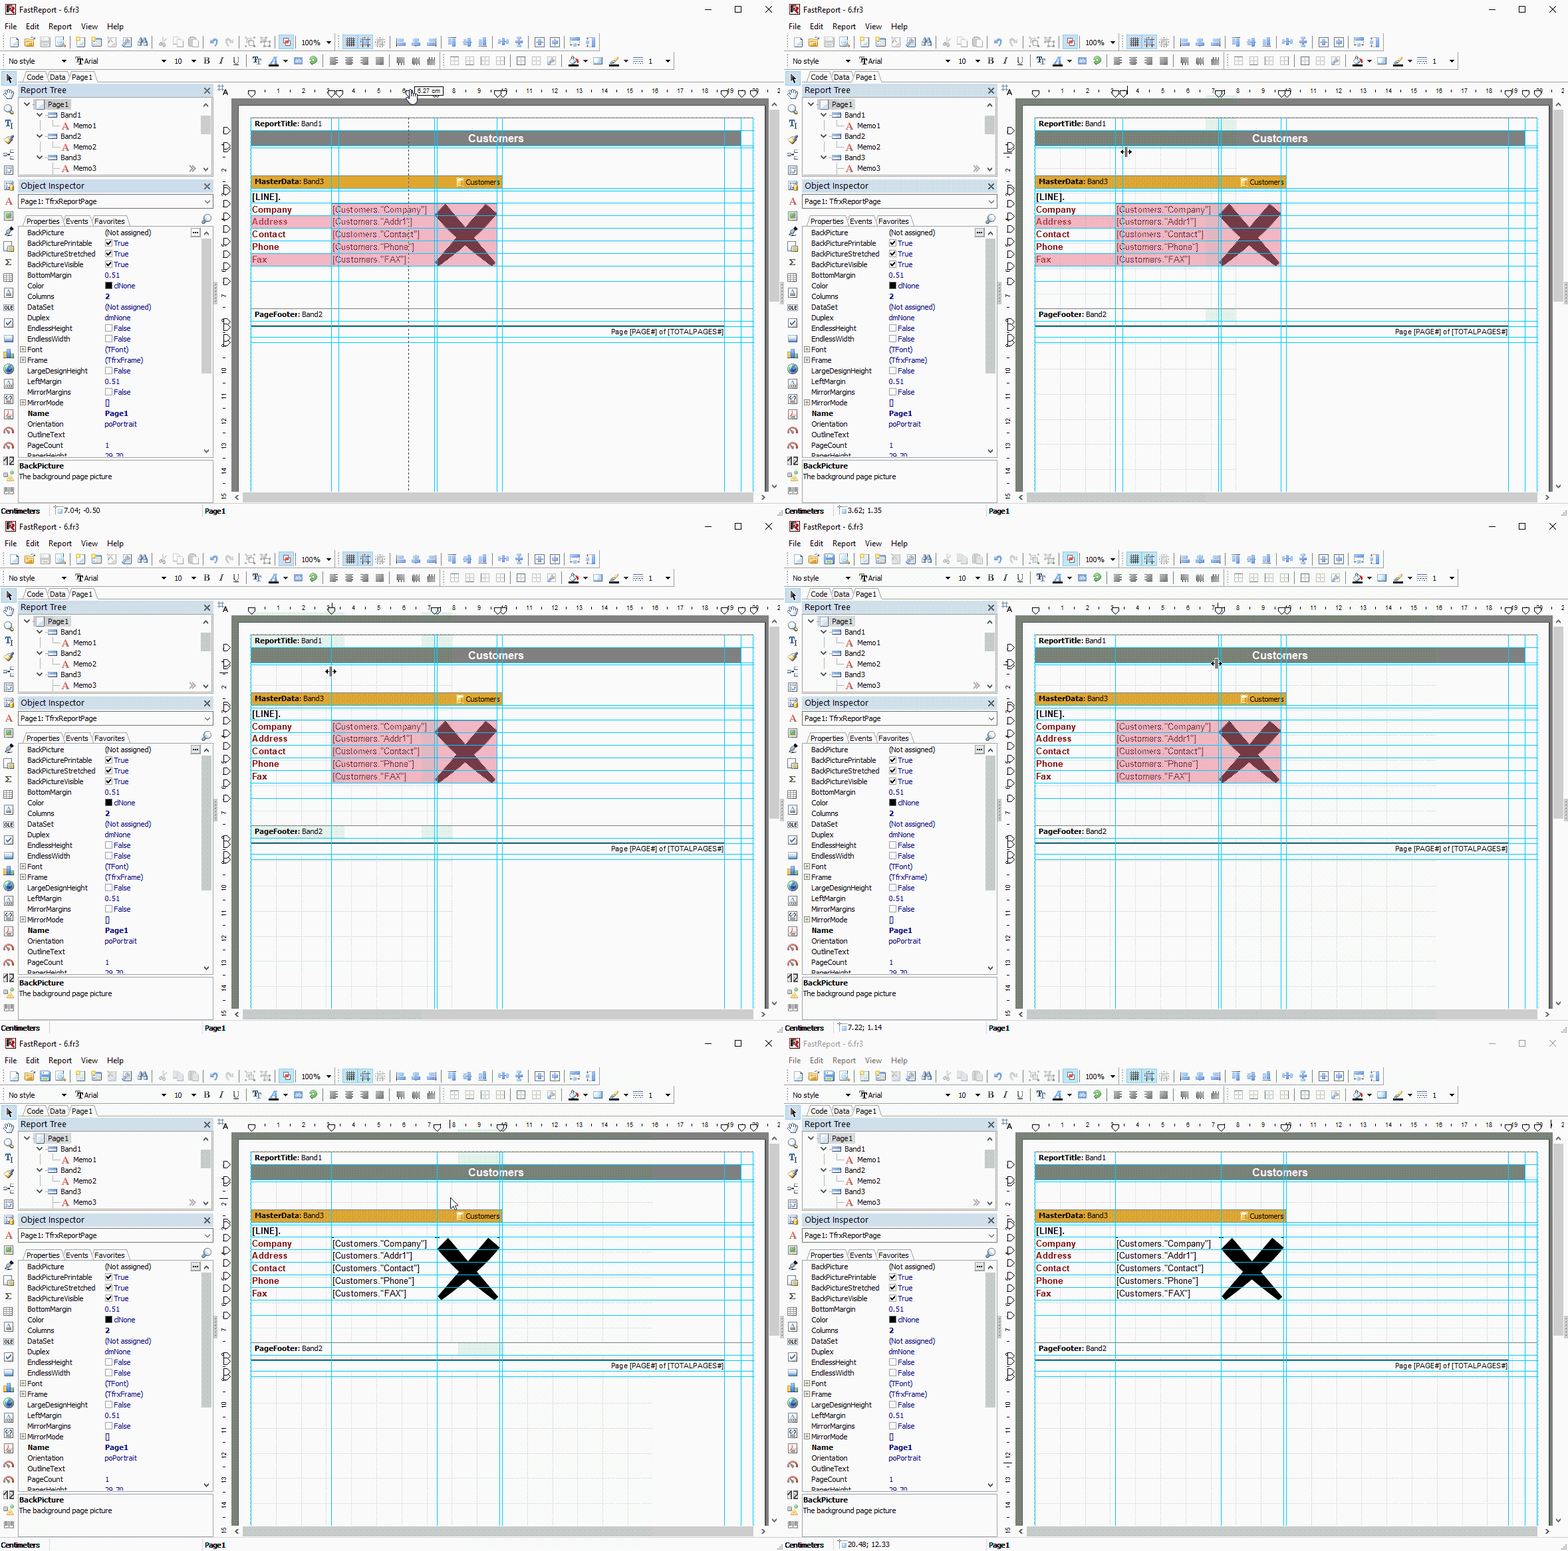
Press the button and turn on the mode of automatic extension lines with full display . Now you can move the extension lines with problem objects.
In this mode, problem areas are clearly visible, which can show up when using table export filters.
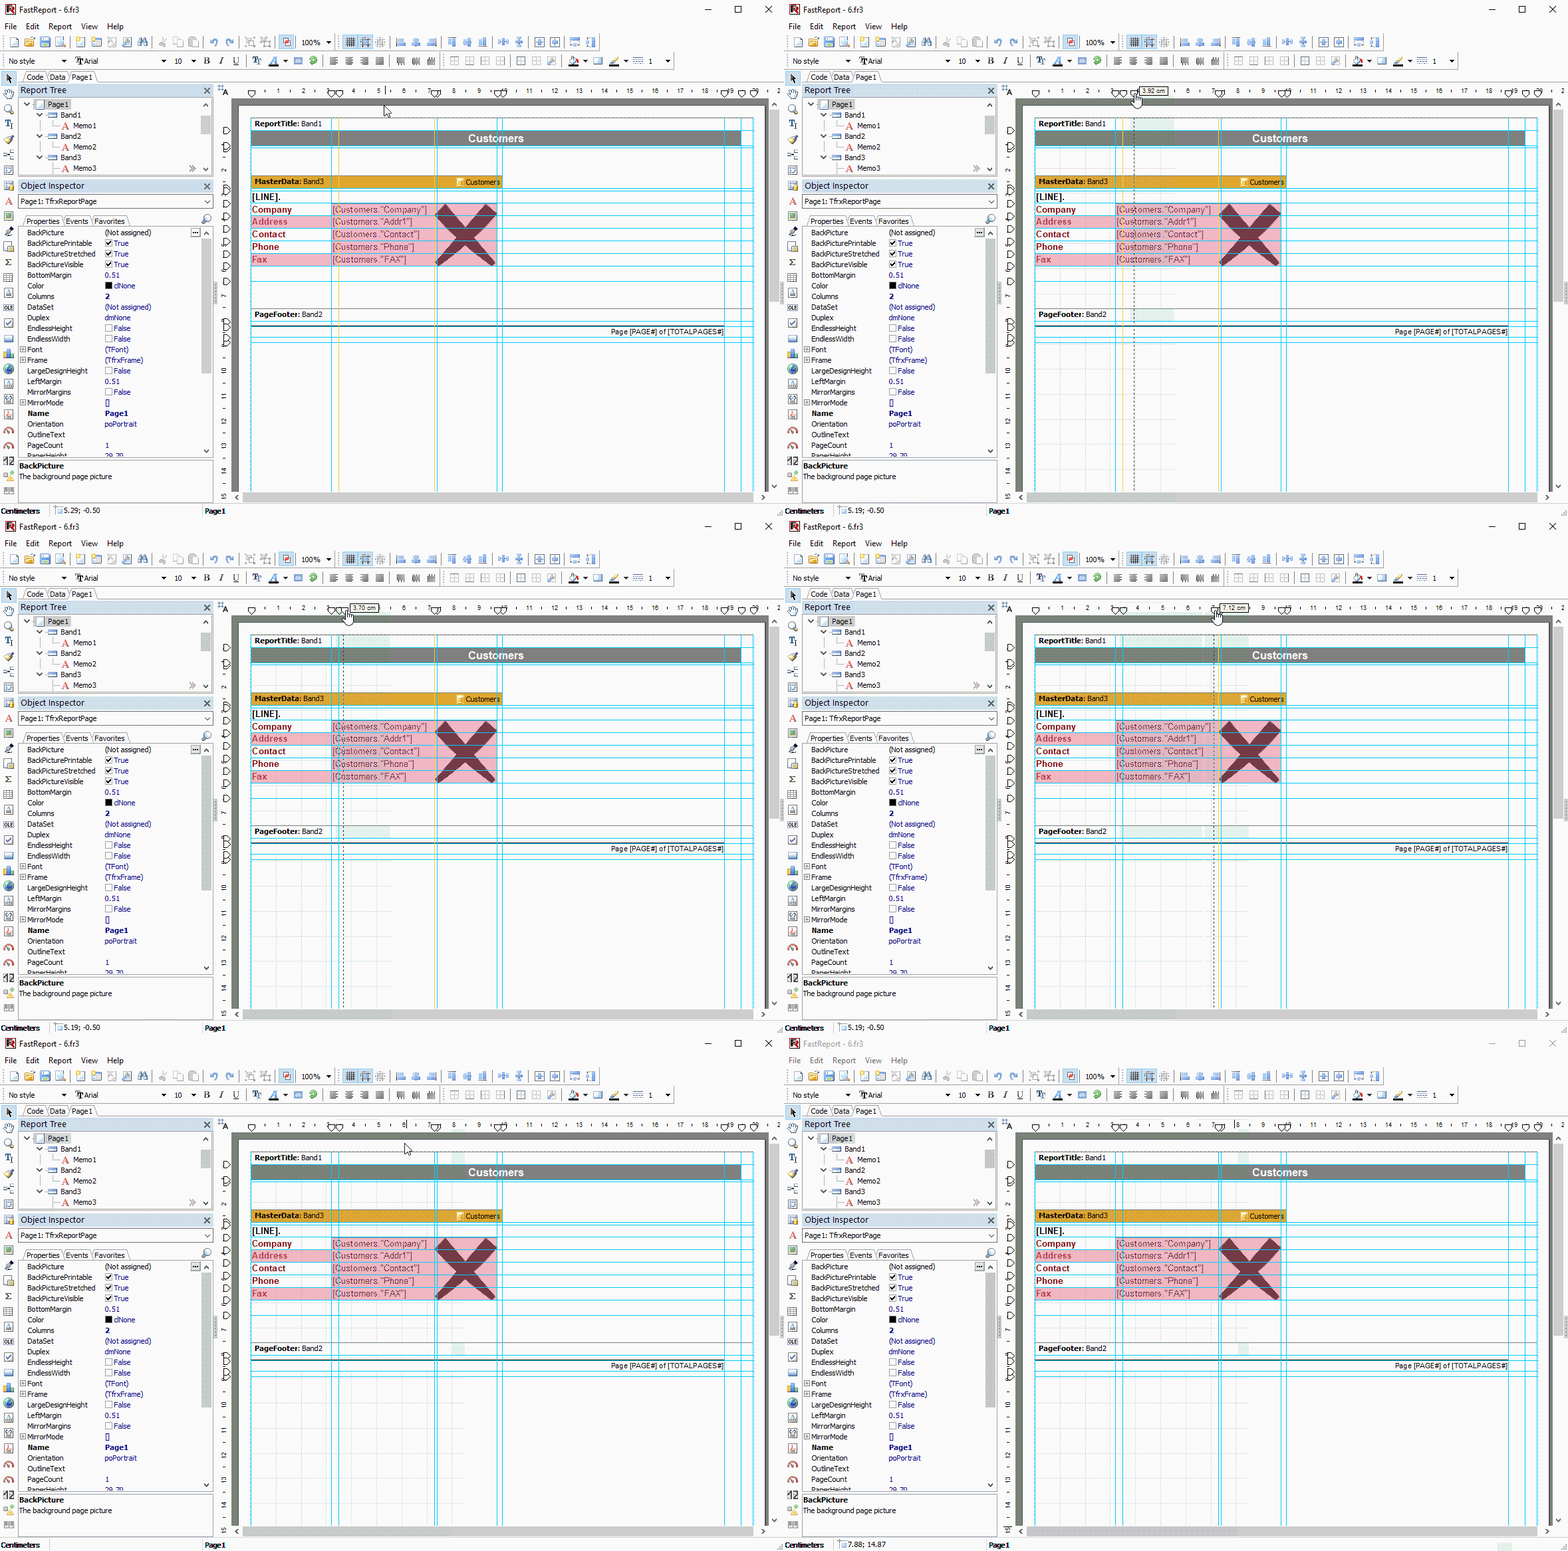
But these are not all the features of the "auto-guides" mode. In this mode, the report designer can add any of the "auto guides" to custom page guides. It is enough to move the guideline pointer on the ruler and click the plus sign.
This allows you to create custom guides that will be used for alignment when new objects are added to the report.
Of course, "auto guides" can be removed from custom guides in the same way as when added. Move the guideline pointer on the ruler again and press the minus sign.
This functionality offers the report developer a whole range of beautiful and intelligent reports that can be exported to any data format.


