How to create a sales receipt from WinForms application
Most likely every .NET developer started from Windows Forms applications. Countless number of such applications is created every day all around the world. These are the applications that bear the brunt of the user’s daily work, whether it is a text editor or some kind of information accounting system. Compared to console applications, Windows Forms are designed to get the full use of graphic elements – forms for displaying information and interacting with the user. It is much more convenient to work with such programs than with console ones.
By developing information systems, we provide the user with the ability to work with data – add, edit and delete items, but most importantly – display information in a readable form. Reporting is an integral part of the program in terms of displaying information. Reports allow you to display information in the right form – bills, receipts, invoices, etc. After all, with the transition to electronic document management, the bureaucracy has not decreased and we need to create documents according to special forms and standards.
One of such documents, as mentioned above, is a sales receipt. If your information system or automated accounting system is designed to track sales, then you need to issue such a document to your customer. In this article, we will look at how to output a sales receipt from your WinForms application. The simplest (and most logical) way is to use the report generator to create the desired document template and get the data from the user application.
So, let’s look at how to create a sales receipt template in the FastReport.NET report designer. In fact, it’s very simple. To create the report template, you need to connect to a data source. There are two ways to do it:
1) Create a data source in your user application, then call the report generator during execution of the program and create a template. However, in this case after creating the report template we will have to stop the application and make changes to its code for exporting the created report to the desired format.
2) Run the report designer, connect it to the data set (the one you will use in the user application for transferring the information to your report). After that you need to create and save a report template. Then, after developing your application, indicate the path to the created report.
Our task is to create the following template:
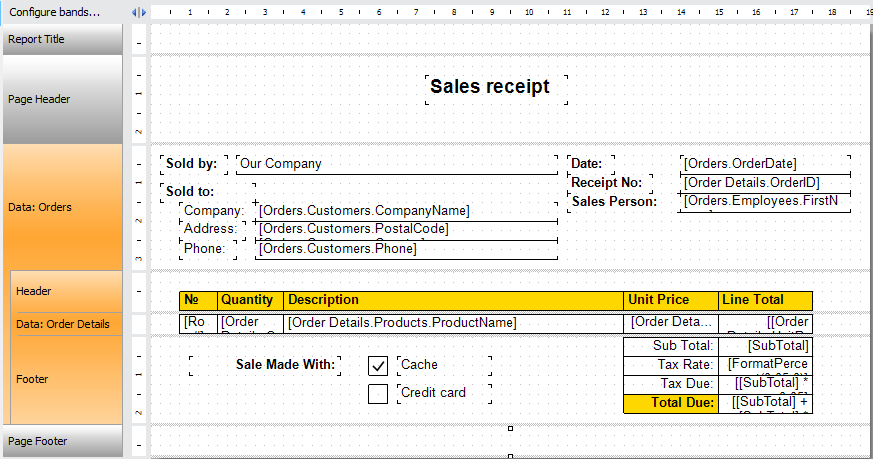
In the sales receipt information about the seller, buyer and sold goods will be displayed. Some countries tend to separately indicate the tax rate and calculate the tax due as well as the final amount after taxes. First of all, it is necessary to say about the data structure. The content of data bands also depends on it.
In our case, the information about sales is taken from the tables: Orders, Order Details, Products, Employees and Customers. To display data for a specific order from each table, all of them must be connected. To do so, FastReport.NET provides a mechanism for linking tables by keys:
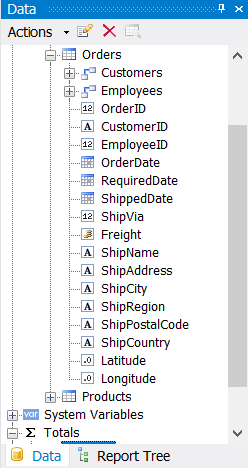
The Orders table is linked to Customers and Employees tables. This means that for a specific order record, the corresponding data will be selected from these tables by key.
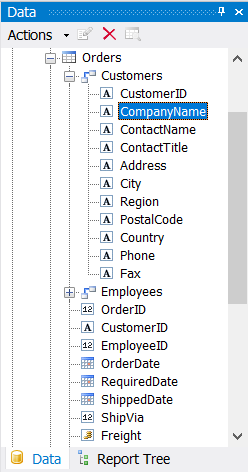
Look at the report template screenshot. For the data band the Orders source is selected. This means that if we need to display information from Customers and Employees tables, we need to take it from the linked tables:
The Data band has a detailed band with its header and footer bands. For the detailed Data band, the Order Details source is defined. This table also has links:
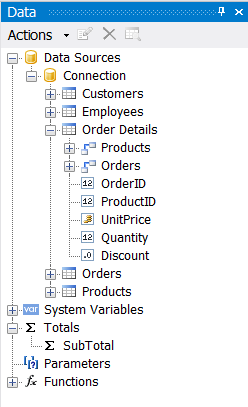
As you probably expected, it is linked to the Orders table, as well as with the Product table from which you can get the product names.
Now, when it’s clear that the main information is taken from the Orders table and the detailed product information comes from the Order Details table, we can consider the totals.
The first is Line Total – the multiplication of the goods quantity by the price is calculated by simply multiplying the fields: [Order Details.UnitPrice] * [Order Details.Quantity]]. This total is calculated for each item.
Next you need to summarize all the totals in this column and display them in Sub Total field. To do this, create a new Total in the Data window:
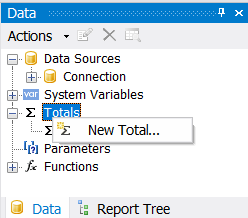
Let’s give it SubTotal name and set the properties in the appeared window:
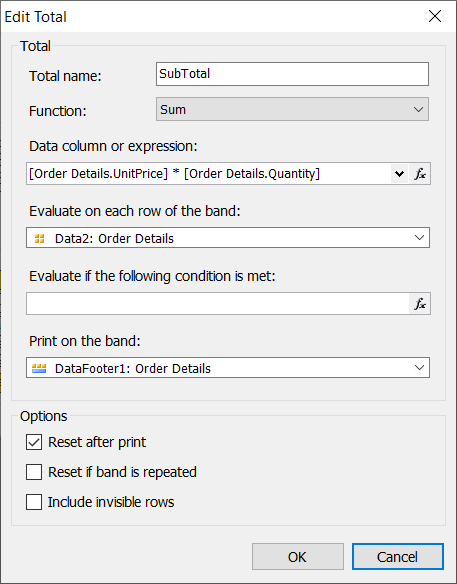
As you can see, we used the Sum function to the Total. For the data expression we used a combination of multiplying the same fields as in Line Total. Thus we get the sum of all totals for all products.
The Tax Rate field indicates the percentage of the tax base that must be paid in taxes. In our case this number is 5%.
For the Tax Due field, you need to calculate the amount due for tax. The formula is simple: total * interest rate:
[[SubTotal] * 0.05]
And, finally, the Total Due. It consists of the sum of subtotal and tax:
[[SubTotal] + [SubTotal] * 0.05]
This completes the creation of the sales receipt. You need to save the report template.
In the application
After creating a report template, you can load it into your application, set the data source, build it and export to, for example, PDF format.
1 2 3 4 5 6 7 8 9 10 |
DataSet data = new DataSet(); //Create the data set data.ReadXml($"{Application.StartupPath}/nwind.xml"); //Load XML to it Report report = new Report();//Create a report report.Load($"{Application.StartupPath}/SalesReceipt.frx"); //Load the report object to the template report.RegisterData(data); //Register data in the report report.Prepare(); //Prepare a report using (var export = new FastReport.Export.PDF.PDFExport()) { export.Export(report, "SalesReceipt.pdf"); //Export report to PDF } |
That’s it, you can add this code to the button click processing and you will need only to click the button in your application to create a sales receipt. Now you’ve seen how easy it is to create and display documents using the report generator.