How to select the top values in a matrix
The article is relevant until version 2022.1.
FastReport .NET has a great tool for displaying data as an integrated table or matrix. Many of us would like to improve the functionality of matrices, for example, with such a useful option as a choice of N top values. It seems as simple as selecting the N top lines from a data source. However, besides making a selection of the top values, it is necessary to group all the rest data into a single recording, which is the main problem. This cannot be done with the built-in tools of the Matrix object.
Thus, we have to prepare the data so that they contain both the top values and the sum of all the rest values. This means is suitable for SQL databases. Everything we need is to write an SQL query.
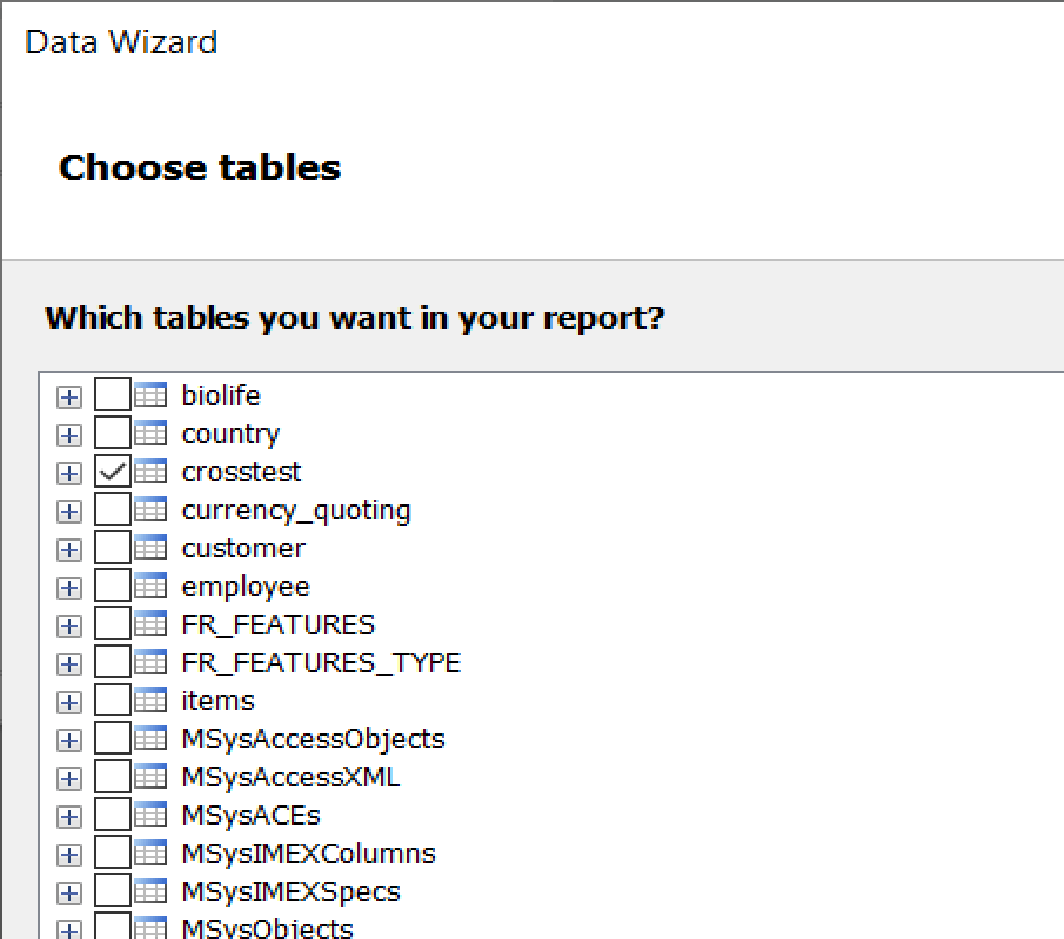
Assume we produce a list of employees’ wages by years. In the data source editor, we may use an SQL query, if an SQL database is used.
This is how the SQL query, which will select 2 top values and the sum of all the rest values, will look like:
SELECT top 2 name, year, month, salary FROM crosstest ORDER BY salary
UNION
SELECT 'Other' AS name, year, month, SUM(salary) FROM crosstest
WHERE name NOT IN (SELECT Top 2 name FROM crosstest ORDER BY salary)
GROUP BY name, year, month
Here we combine two queries with a union operator. In the first query, we choose the top values, in the second query — the sum of all remaining values.
As a result, we obtain the following matrix:
As you can see, by using various techniques of preparing initial data, we can obtain the desired effect, even if such functionality had not been initially provided in the report generator.

