How to make label type report in FastReport VCL
Printing labels is one sphere of application of report generators. In this article, we will look at some aspects of creating a report with labels.
In label reports, data headers are usually placed in a column, rather than in a row, as usual. What does it mean? I will show you by an example.
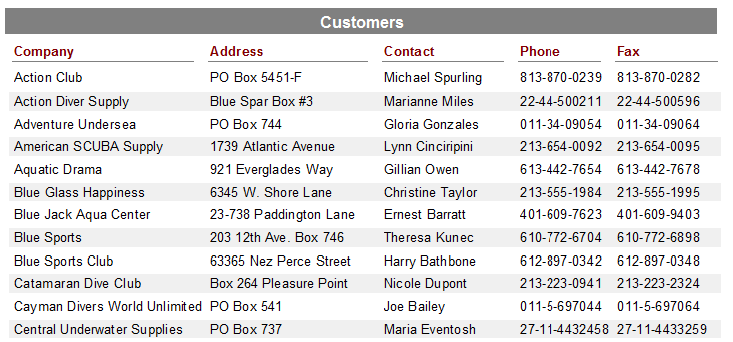
Here is an ordinary list of data output row by row:
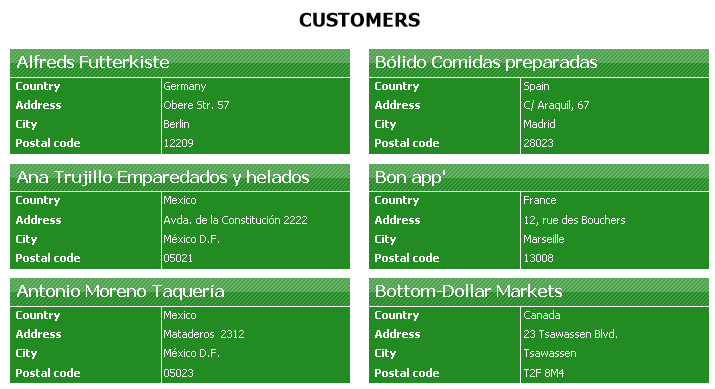
And here is the columned placement of data:

As you can see, the main point of the report with the labels is to form a label of the right size and content. To do this, you must specify the size of the report page according to the size of the label. Let's look at the example.
Create an empty report with one MasterData band. Our goal is to make business cards. Since the report consists of one band, the size of the business card will be equal to the size of this band. Let's set the height of the MasterData band in the Property inspector. Set the value to 4.5 cm. To specify the width of the band, we need to use a division into columns.
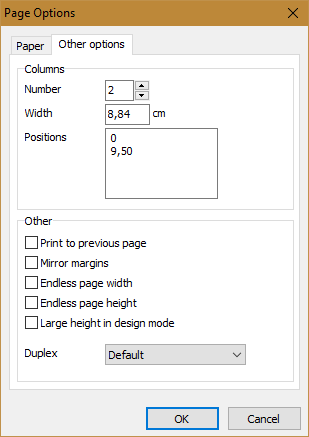
To split a page into columns, open the File -> Page Properties menu. On the Other options tab, set the number of columns to 2. You can also change the width of the columns. For example, we set 8.84 cm. At the same time, the band became already more than the half page of the report. You can adjust the position of the band in the Positions property.

And now we will create not a complicated business card template:

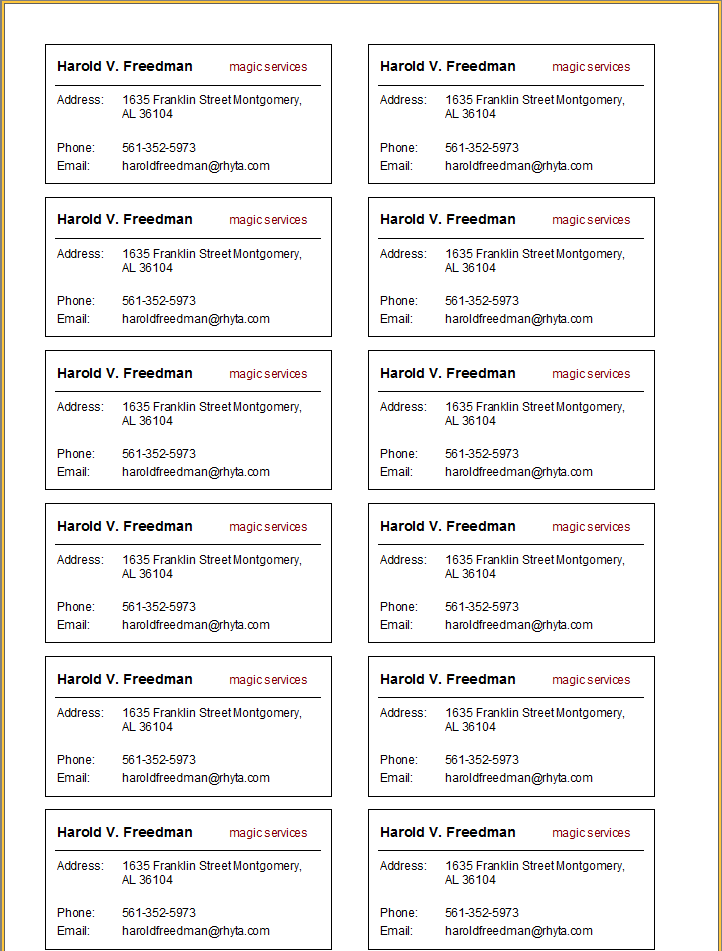
Since we do not use the database in the MasterData band, we need to manually set the number of records in the properties of the band. In our case - RowCount = 12. Let's look at the report in the preview mode:

As you can see, all 12 labels fit one report page, which (in our case) is printed in A4 format.
If you use data from the database, you should leave the RowCount property for the MasterData band to 0.