Complex report with multiple matrices in FastReport.NET
Today we will look at a complex report with a band-oriented approach, which is usually used in FastReport. For example, a report on sales broken down by years, quarters and months, where you want to display three tables with data, which should be located not from top to bottom but from left to right. Fortunately, we can make this report in FastReport .NET using several Matrix objects.
Let's take a look at the data. They are generated randomly following a certain pattern:
The database contains data on the import of fruits from different countries, broken down by months. Each record has an “amount” field where the amount of imported fruits is stored.
We will use the Matrix object to display the data. Let's go to its settings:
The name of the country and the type of fruit will be our strings, the rows will contain a breakdown by year, quarter and month, and the number of fruits will be the cells of the matrix.
We have indicated what data will be used in the matrix. Let's apply borders for all cells, and adjust the page settings. We will apply "unlimited height" and "unlimited width" so that our report makes up one sheet. After that, we will prepare the following report:
The data will go to the right for 2018 and 2019.
First of all, note that totals have been automatically added for all columns. If we do not need them, we can remove them, which we will do. To display zeros instead of empty cells, you need to set the NullValue property of the cell. As a result, 0 should appear in it. In addition, let’s disable autosize for the table and adjust the result:
Our task is to make statistics using several matrices:
1) By years;
2) By quarters;
3) By months.
Let’s copy the matrix and place its two copies next to the original. Then we apply “extra space in the designer” to insert everything. Note that when you copy a matrix, it is unlinked from the data and you need to select the required data table in the DataSource property.
Let's remove unnecessary fields from matrices and move them closer to each other:
Let's try to prepare such a report:
As you can see, there are several problems in the report:
1) Matrices are displayed differently because headers have different heights;
2) Countries and types of fruits are repeated in the second and third matrices.
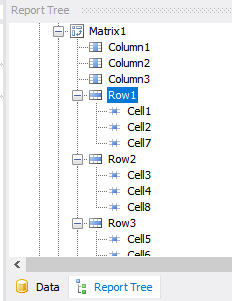
Let's increase the height of the “Year” row in the first and second matrices. To select a row, you can hover your mouse over the left side of the matrix. When the mouse is over one of the rows, it will turn into a black right arrow. In addition, you can select a row in the report tree:
Now all headers are the same height:
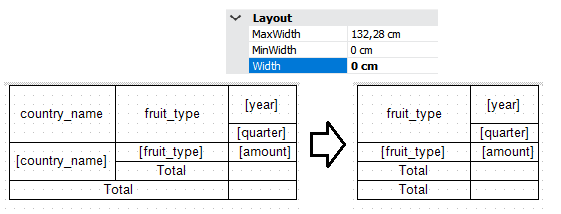
Matrices in FastReport allow you to “hide” a column or a row by reducing their size to zero. In our case, we need to hide the “country names” with “fruits” in the second and third matrices. Select the column and reduce its Width to zero:
After repeating this several times, as well as after moving the matrices together, we get the following pattern:
Note that these are three separate matrices, not one. But they work as one complex matrix because they have identical header and cell height, as well as the same dataset.
Let's take a look at the report now:
This screenshot shows that the names of the countries are no longer displayed, and that there is no conflict between the matrices.
Finally, let's pretty up our matrix:
For example, in order to add a word to a year number, you need to remember the fields of the matrix contain expressions. If the field contains such text, then an error will occur:
Year [fruit_import_database.year]
The right way to do it is:
"Year " + [fruit_import_database.year]


